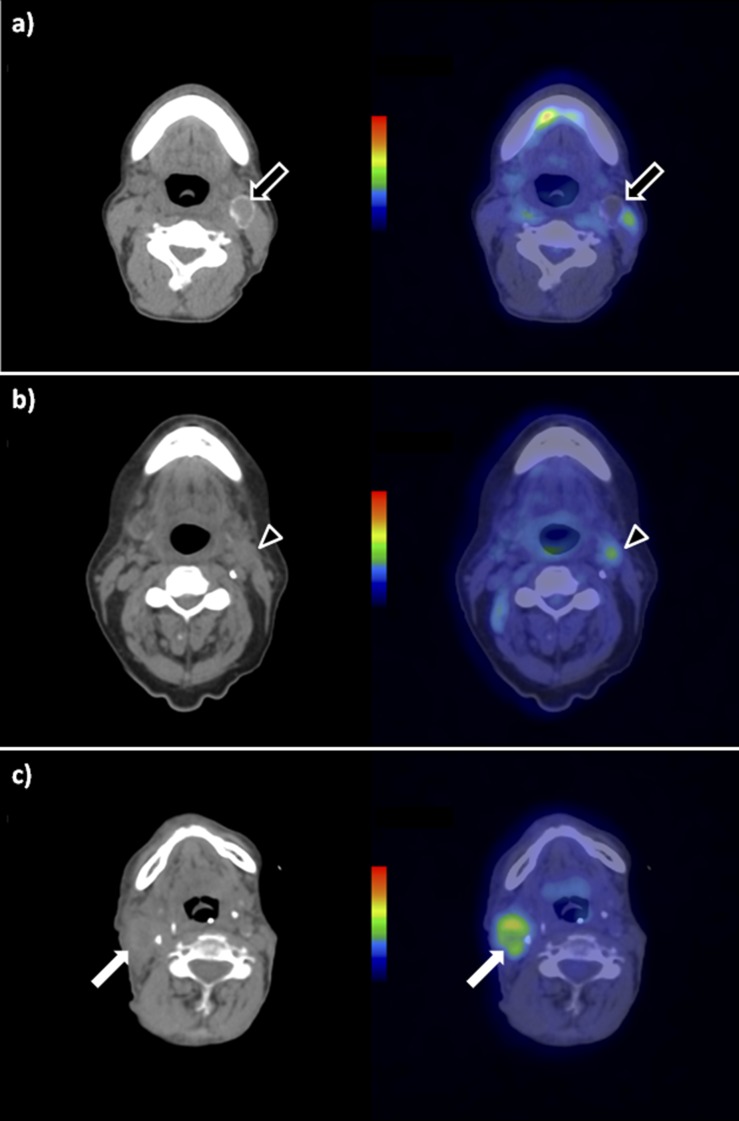
Figure 1.
Lymph node appearances on 18-fludeoxyglucose positron emission tomography (PET)-CT post-chemoradiotherapy. Nodal appearances following chemoradiotherapy on axial unenhanced CT (left column) and axial fused PET-CT (right column). (a) Negative node: 2 cm photopenic residual left Level II node. The presence of calcification post treatment is consistent with a healing response. Arrows, left Level II lymph node. (b) Equivocal node: 1.5 cm residual left Level II node displaying low-grade uptake [maximum standardized uptake value (SUVmax), 2.7]. Arrowheads, left Level II lymph node. (c) Positive node: 3 cm residual right Level II node displaying moderate-grade uptake (SUVmax, 5.3). Arrows, right Level II lymph node.

