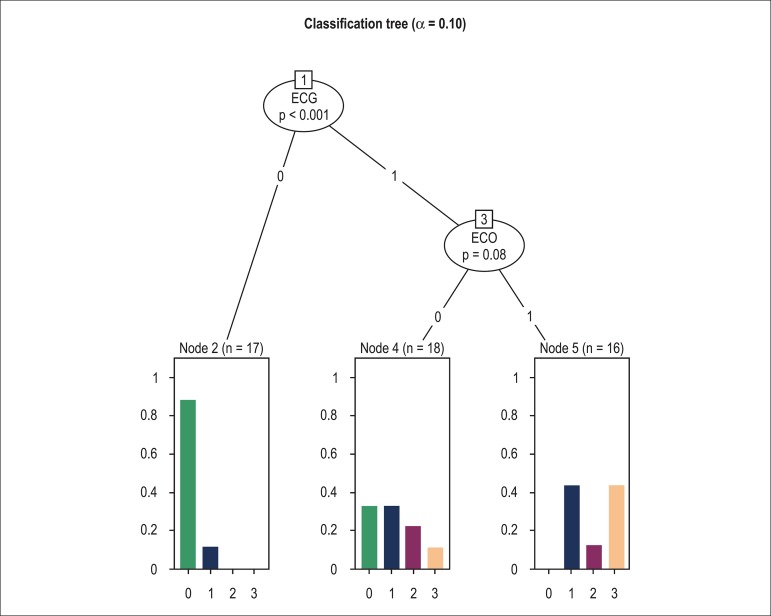
Figure 3.
Classification tree analysis of the association between results in the cardiovascular tests with the neurological classification. ECG 0 = Normal ECG, ECG 1 = Abnormal ECG, ECO 0 = Normal echocardiogram, ECHO 1 = Abnormal echocardiogram. In the abscissa axis, 0 = PND 0, 1 = PND I, 2 = PND II, 3 = PND > II.

