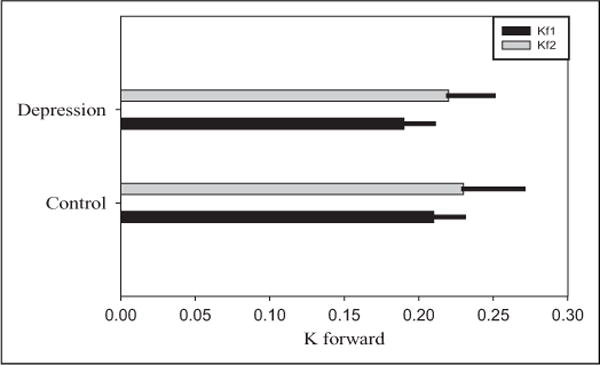
Figure 2.

Bar and error line widths represent mean and SD of kfor, respectively. kfor was nonsignificantly lower for BPD than controls at baseline (kfor: BPD mean (SD) = 0.19 (0.02), control mean (SD) = 0.20 (0.02), Wilcoxon exact P = .40). There was also no significant difference in kfor changes after treatment (Wilcoxon exact P = .91). BPD indicates bipolar depression; SD, standard deviation; kf1, baseline; kf2, week 8.
