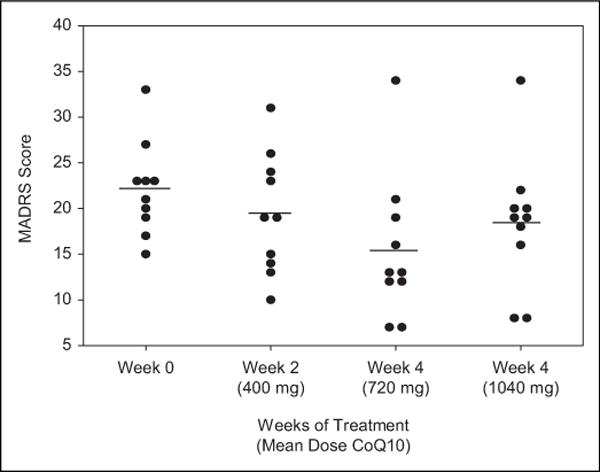
Figure 3.

Points represent observed MADRS scores for each participant with BPD in the sample, and lines represent the mean across participants. Mean (SD) MADRS scores were baseline: 21.4 (5.4), week 2: 19.4 (6.6), week 4: 15.4 (7.9), and week 8: 18.4 (7.3). Differences in mean MADRS scores across 8 weeks were statistically significant (F3,7 = 4.87, P = .04). MADRS indicates Montgomery Asberg Depression Rating Scale; SD, standard deviation
