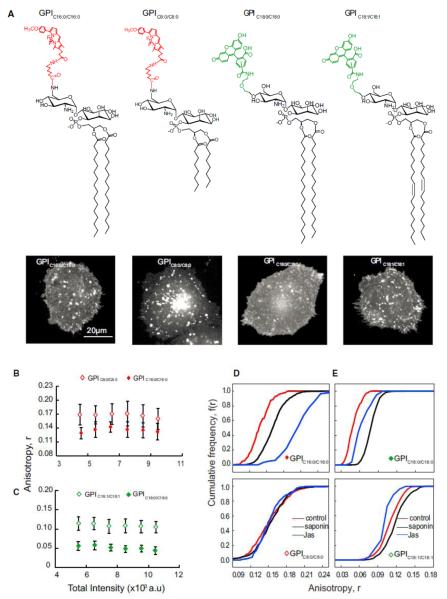
Figure 1.
Long-Saturated-Acyl-Chain-Containing GPIs Support Nanoclustering (A–E) Chemical structures of synthetic minimal GPI analogs (A) outline the variation in the di-acyl glycerolipid chain length (C16:0 and C8:0) and saturation (C18:0 and C18:1) used in this study. GlcNPI carry fluorescent labels BODIPYTMR (left) or fluorescein (right). Representative gray scale images of CHO (IA2.2F) cells with exogenously incorporated GPI analogs as indicated are shown below each analog. Fluorescence anisotropy of GPIC16:0/C16:0 (red closed diamonds) or GPIC18:0/C18:0 (green closed diamonds) in comparison to GPIC8:0/C8:0 (red open diamonds) or GPIC18:1/C18:1 (green open diamonds) determined from images as above were plotted against a wide range of intensity of fluorescent GPI analogs available at the membrane of live cells. Scale bar, 20 mm (B, C). Cumulative frequency distributions (CFD) derived from data derived from identical intensity ranges of GPIC16:0/C16:0 and GPIC8:0/C8:0 (D) or GPIC18:0/C18:0 and GPIC18:1/C18:1 (E) incorporated into cells show the effect of cholesterol depletion by saponin treatment (sap; black line) or on blebs prepared by treatment with jasplakinolide (jas, blue lines) with respect to untreated cells (control, red lines). Each data point in the graphs represents average anisotropy with SD for the corresponding intensity bin obtained from a 10310 pixel region (20–50 regions per cell) from at least 40 cells from 2 independent experiments. Error bars represent SD. See also Figures S1 and S2.

