Figure 2.
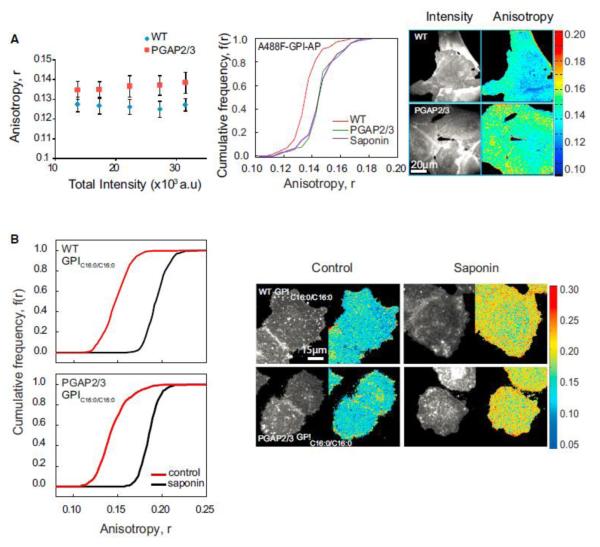
GPI-AP Nanoclustering Is Reduced in GPI Anchor Lipid Remodeling Mutants (A and B) Fluorescence anisotropy of fluorescently tagged FLAER_ (Alexa-488-FLAER, A488F) in wild-type and PGAP2/3 double-mutant CHO cells (blue diamonds and red squares, respectively) plotted against fluorescence intensity shows an increase in anisotropy in mutant cells (A), corresponding to a loss of homo-FRET between A488F-labeled GPI-APs. Intensity and anisotropy were determined from images collected from cells as shown on the right. CFD plots and images (A) for wild-type (red line), PGAP2/3 double-mutant (green line) and saponin treated (violet line) cells and (B) for GPIC16:0/C16:0 in control (red line), and cholesterol-depleted (black line) conditions in WT and PGAP2/3 mutant cells. CFD plots show that A488F-labeled GPI-APs in mutant cells exhibit an increase in anisotropy compared to wild-type cells and exogenously incorporated GPIC16:0/C16:0 exhibit significantly depolarized fluorescence anisotropy (control) in both wild-type (top) and mutant cells (bottom) that is sensitive to cholesterol depletion by saponin (black line). Each data point in the graphs and CFDs represents average anisotropy values derived from nearly 40 cells from 3 independent experiments. Error bars represent SD.

