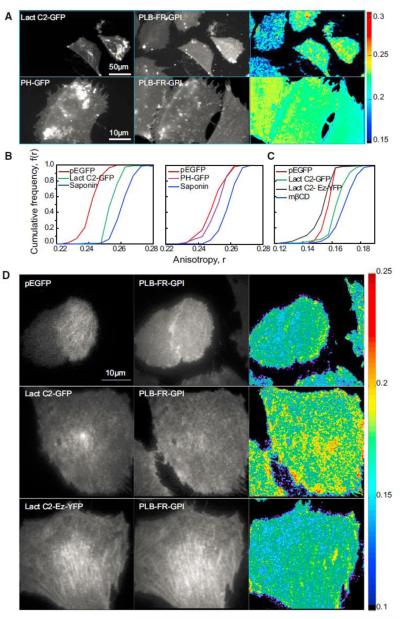
Figure 3.
Masking of PS Binding Sites Alters GPI-AP Nanocluster Organization (A–D) Cropped fluorescence intensity and anisotropy images of FR-GPI-expressing CHO cells (A and D) transfected with EGFP, EGFP tagged to C2 domain of lactadherin (Lact C2 GFP), PH domain of PLCd (PH GFP), or a fusion construct of Lact C2 and actin binding domain (Lact C2-Ez-YFP) and corresponding CFD plots (B and C) were obtained from wide-field (A and B) and TIRF (C and D) microscopes, respectively. The fluorescence anisotropy of PLB bound to FR-GPI in cells expressing EGFP (red line) is comparable to that obtained in PH-GFP (violet line, middle) or Lact C2-Ez-YFP (black line, right) but is increased in cells expressing Lact C2-GFP (green line, left or right). This is in turn comparable to cells treated with saponin or mbCD (blue line). See also Figure S3.

