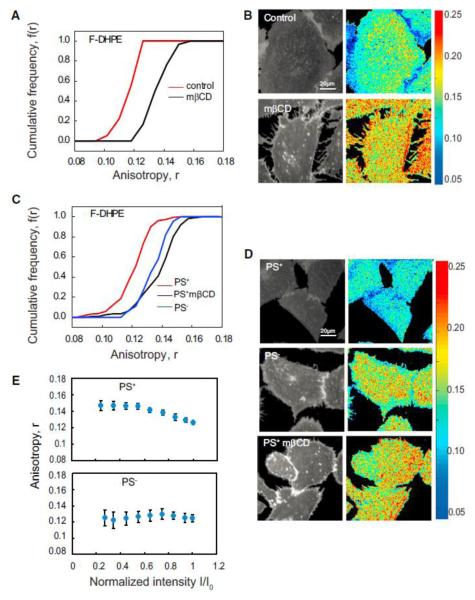
Figure 6.
Lipids with Long Saturated Acyl Chains Are Sufficient to Drive Nanocluster Formation (A–D) Cumulative frequency distribution (A and C) and fluorescence intensity and anisotropy images (B and D) of F-DHPE incorporated in control (IA2.2F) cells (A and B) and PSS1-deficient (PSA3) CHO cells (C and D) show that the fluorescence anisotropy of F-DHPE in control cells and PS replete (control, PS+; red line) is depolarized compared to that measured in cholesterol depleted (black line) or PS-deficient (PS_) cells (blue line). Note that fluorescence anisotropy of FDHPE in PS deplete (PS_) cells (blue line) is similar to that measured in saponin-treated cells (black line). Each data point in the graphs represents average anisotropy with SD for the corresponding intensity bin obtained from a 10310 pixel region (20–50 regions per cell) from at least 40 cells derived from two independent experiments. (E) Photobleaching profiles of F-DHPE incorporated into PS replete (PS+) cells and PS deplete (PS_) cells. PS replete (PS+) cells and PS deplete (PS_) cells were incorporated with exogenously added F-DHPE (E) photobleached and the fluorescence emission anisotropy recorded during the photobleaching process. Note that the profiles of change in fluorescence anisotropy upon change in fluorescence intensity in case of PS replete (PS+) cells are characteristic of nanoclustered fluorophores (Sharma et al., 2004), whereas PS deplete (PS_) cells exhibit no change, indicating the lack of homo-FRET. The starting intensity for all the samples collected here is similar and normalized to that used in the first frame.
Error bars represent SD. See also Figure S4.

