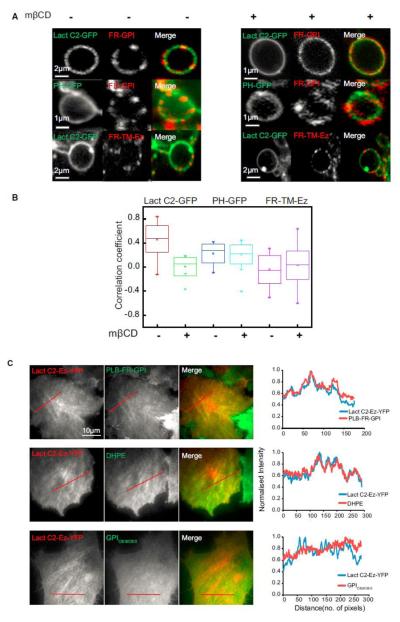
Figure 7.
Crosslinking of Either FR-GPI at the Outer Leaflet or PS at the Inner Leaflet Demonstrates a Strong Transbilayer Coupling (A) Cropped images of membrane blebs obtained after jasplakinolide treatment cells expressing Lact C2 GFP or PH GFP (left, green in merge) either with (treated) or without mbCD (control), followed by cross-linking FR-GPI or FR-TM-Ez (middle, as indicated; red in merge) with primary and secondary antibodies to create micron-sized patches of these proteins. (B) Graph shows the extent of correlation between the intensity fluctuation of crosslinked FR-GPI or FR-TM-Ez and PH GFP or Lact C2 GFP both in the presence (+) and absence (_) of mbCD, determined from images of blebs (pooled from three independent experiments) as shown in (A). (C) Images and normalized line intensity profiles of Lact C2-Ez-YFP transfected in IA2.2 cells labeled with PLB or DHPE or C8 GPI analog as indicated. This shows a strong colocalization in the distribution of Lact C2-Ez-YFP with FR-GPI and DHPE, but not with C8 GPI analog. Red line in (C) depicts the region of line scan measurement. Scale bar, 10 mm. The whiskers represent the outliers. See also Figure S7.

