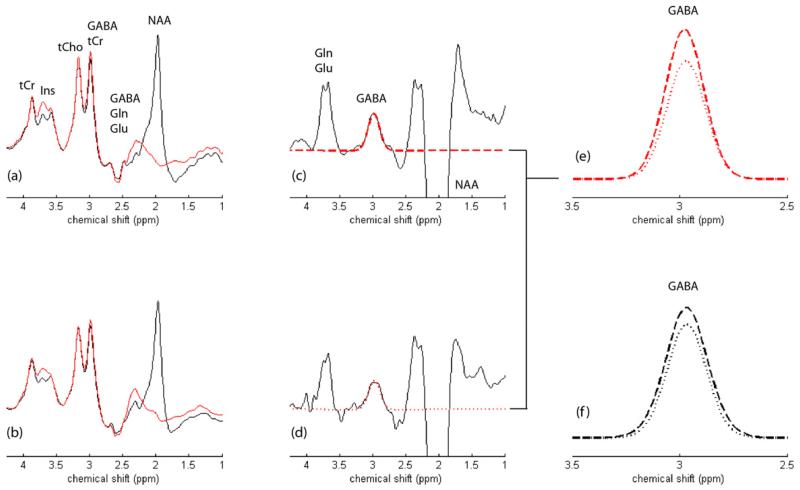
Fig. 2.
(a) and (b) show the MEGAPRESS editing pulse ‘on’ (red spectra) and ‘off’ (black spectra) condition 1H MRS spectra recorded from a HC and MJ subject, respectively. The main signals tentatively assigned in (a) and can be directly translated to (b). The resulting MEGAPRESS difference spectra are presented for the (c) HC and (d) MJ subject, which are characterized by an inverted NAA resonance at 2.0 ppm, the edited GABA peak (plus macromolecule) at 3.0 ppm and a co-edited composite Gln/Glu resonance at 3.75 ppm. The estimated GABA fits are overlaid in both MEGAPRESS GABA-edited datasets (red dashed spectra) with the direct overlay of the HC and MJ GABA fits presented in (e). This particular MJ subject showed a 17% lower CSF-corrected GABA:water ratio when compared to the HC data. The group averaged GABA fits are presented in panel (f) for both the HC (dashed line) and MJ (dotted line) cohorts. Note that the vertical scaling was increased fivefold for the MEGAPRESS-edited data in (c) and (d) whereas the vertical scaling for plots (e) and (f) was enhanced by a factor of twenty.

