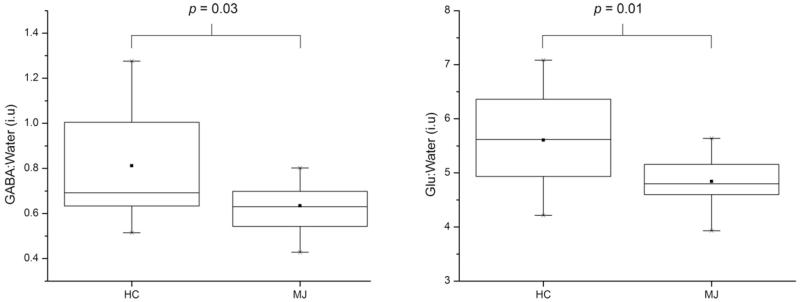
Fig. 3.
Box plots showing the mean water-normalized GABA (left) and Glu (right) levels measured in the HC and MJ cohorts. The ■ symbol and within-box horizontal lines represent the mean and median values, respectively. The box extremities correspond to the 25th and 75th percentiles and the ‘×’ symbol represents the full data range.

