
Fig. 2.
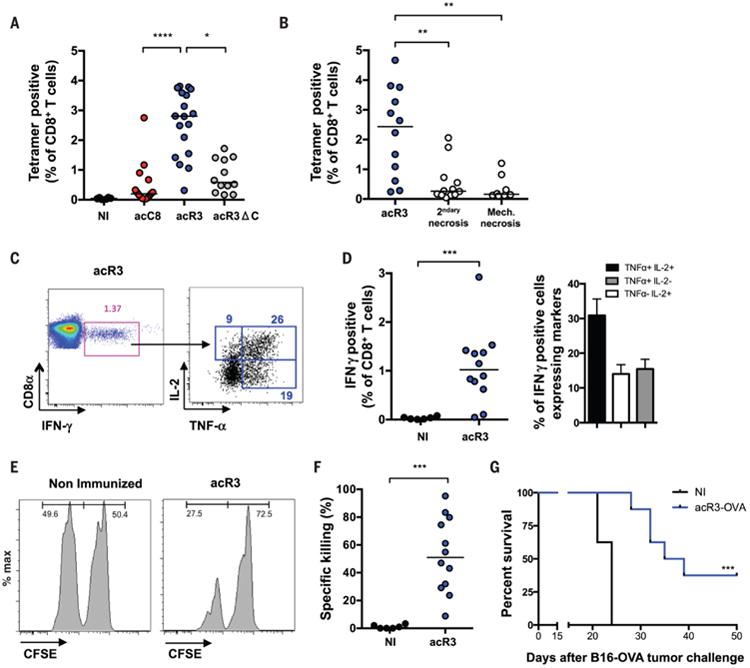
Necroptotic cells are immunogenic and require RHIM-dependent ripoptosome formation for efficient cross-priming of CD8+ T cells. (A to G) To elicit cross-priming we intradermally injected (i.d.) OVA-expressing dying cells (H-2q) into mice (H-2b), and analyzed on day 9 post-immunization (p.i.). (A and B) Using Kb-SIINFEKL-tetramers, OVA-specific CD8+ T cells were quantified and plotted as a percentage of total CD8+ T cells. N=4 (A), N=3 (B) Bars indicate median and results are pooled from three independent experiments with 3-6 mice per group (each circle represent one mouse) (C and D) IFN-γ, TNF-α and IL-2 production in response to ex-vivo SIINFEKL peptide re-stimulation was determined. Representative FACS plots are shown and numbers indicate the percentage of gated cells (C); and frequency of IFN-γ expressing and polyfunctional cells are plotted (D) N=3, results are pooled from three independent experiments with 3-6 mice per group and reported as individual mice (each circle represent one mouse) and bars indicate median (IFN-γ) or as histogram and mean+/− SEM (TNFα and IL-2). (E and F) In vivo cytotoxicity assay was performed in acR3-OVA immunized mice. At day 8 p.i., mice were adoptively transfered with CFSE-labeled splenocytes and the frequency of CSFEhi (irrelevant peptide control) and CFSElow (SIINFEKL loaded) splenocytes (injected at a 1:1 ratio) was determined at day 9. Representative FACS plots are shown (E) and the percent of specific killing plotted (F). N=3, Bars indicate median and results are pooled from three independent experiments with 4 mice per group (each circle represent one mouse). (G) Tumor challenge experiments were performed, injecting 5×10⁵ B16F10-OVA cells on day 12 p.i., N=2, and results are reported as a survival curve from one representative experiment with 8-11 mice per group ; OVA = ovalbumin. p values were determined using KW test followed by Dunn's post-test for (A and B), Mann-Witney (MW) test for (D and F) and mice survival (G) was compared by log-rank test. *P < 0.05; **P < 0.01; ***P < 0.001; ****P < 0.0001.