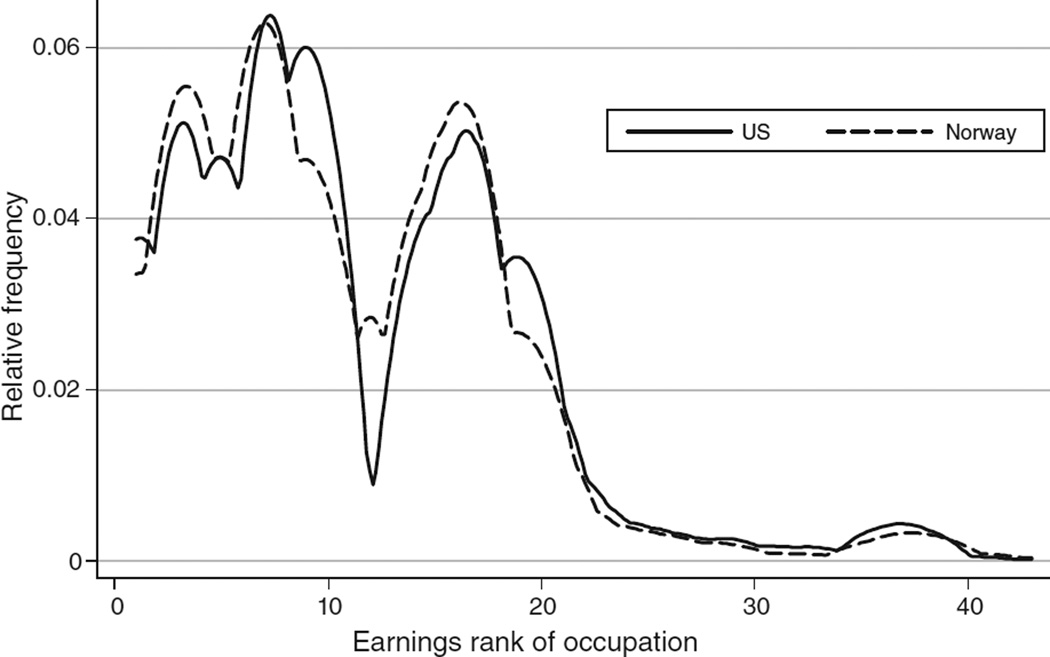
Figure 2.
| N | Mean occupation score (1880) |
Percentage with occupation score < 12 |
|
|---|---|---|---|
| Unmatched | 21,949 | 14.68 | 35.20 |
| Matched | 3,597 | 14.65 | 36.50 |
| Matched (US) | 2,392 | 14.77 | 35.50 |
| Matched (Norway) | 1,205 | 14.39 | 38.40* |
Notes: Return migrants are defined as Norwegian-born men observed in the 1880 US census who are matched to the 1900 Norwegian census (N = 1,205). Persistent migrants are Norwegian-born men in the US census of 1880 who are matched to the 1900 US census (N = 2,392). For comparison, unmatched men are Norwegian-born men in the 1880 US census who cannot be matched to either Norway or the United States in 1900. The occupation score measure, which is taken from the 1880 IPUMS sample, is constructed by ordering occupations according to their median earnings in 1950. The mean occupation score and share of the sample with an occupation score in the bottom quartile (score < 12) are reported in the accompanying table. On both measures, the differences between matched and unmatched men are not statistically significant. We mark differences between return and persistent migrants that are statistically different at the 10 percent level with an *.

