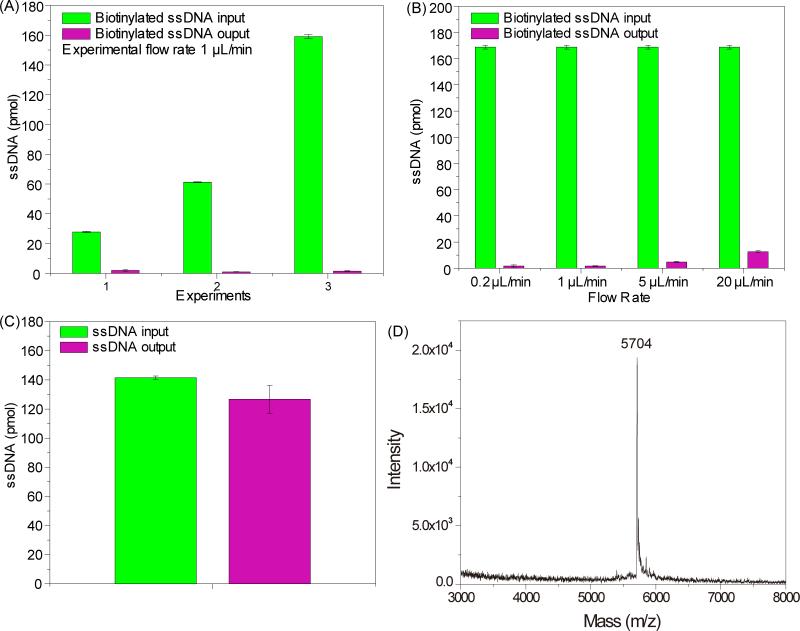
Fig. 5.
(A) Total amounts (pmol) of biotinylated ssDNA (5163_biotin) inflow and outflow from the SPP chamber at a flow rate of 1 mL mi−1. (B) Total amount (pmol) of biotinylated ssDNA (5163_biotin) introduced into and obtained from the SPP chamber at different flow rates. (C) Total amount (pmol) of ssDNA (5163) inflow and outflow from the SPP channel at a flow rate of 1 mL mi−1. (D) MALDI TOF mass spectrum of released extension products from solid phase after TCEP cleavage. The average values were calculated from at least three repeated experiments, with error bars representing the standard deviation.

