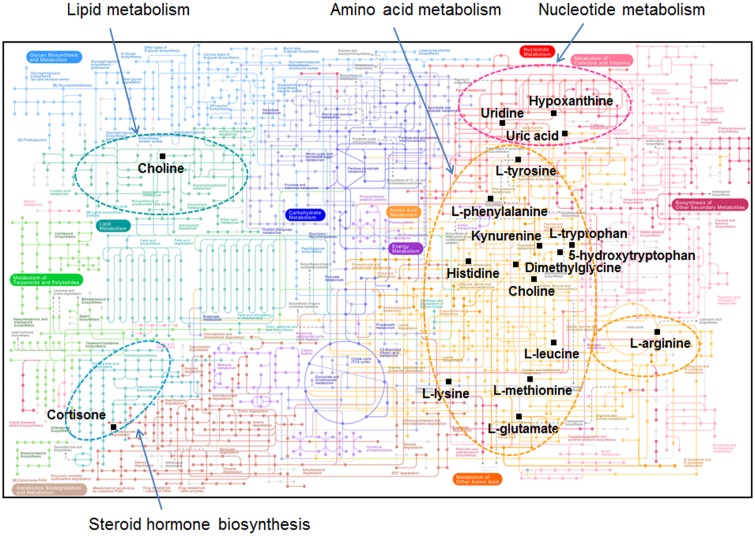
Fig 6. Visualization of metabolic pathways in marmosets that differed from ranges for human values in HMDB.
Quantitatively different metabolites were visualized in the KEGG metabolic pathways. (http://www.genome.jp/kegg/pathway.html#metabolism). Black squares indicate quantitatively different metabolites matched in the metabolic pathways including lipid metabolism, amino acid metabolism, nucleotide metabolism and steroid hormone biosynthesis.

