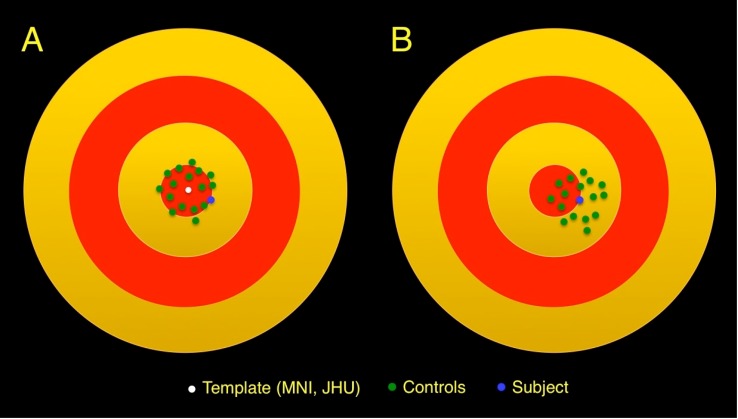
Fig 1. Schematic diagram representing the conformational space of the brain (concentric red and yellow circles).
(A) When the target of the registration process is a brain atlas template, registration of the controls (green dots) and subject (blue dot) result in a distribution of brain conformations around the brain atlas template (white dot). (B) If the target of the registration process is the subject, registration of the controls results in a distribution of brain conformations around the patient.

