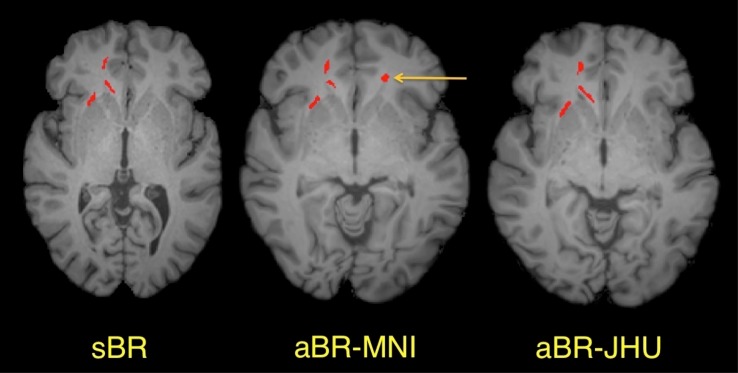
Fig 2. Abnormally low FA clusters detected in a single mTBI patient using three different registration approaches.
Abnormally low FA clusters are shown in red overlaid on axial T1-weighted images: the patient’s anatomy (sBR), the MNI atlas (aBR-MNI) and the JHU atlas (aBR-JHU), respectively (left to right). Most abnormally low FA clusters observed using sBR were also present using the aBR methods, as demonstrated by the 3 clusters seen in the right frontal lobe. However, additional clusters (e.g., yellow arrow) detected using a particular aBR template generally will not overlap with the alternate aBR template or sBR.

