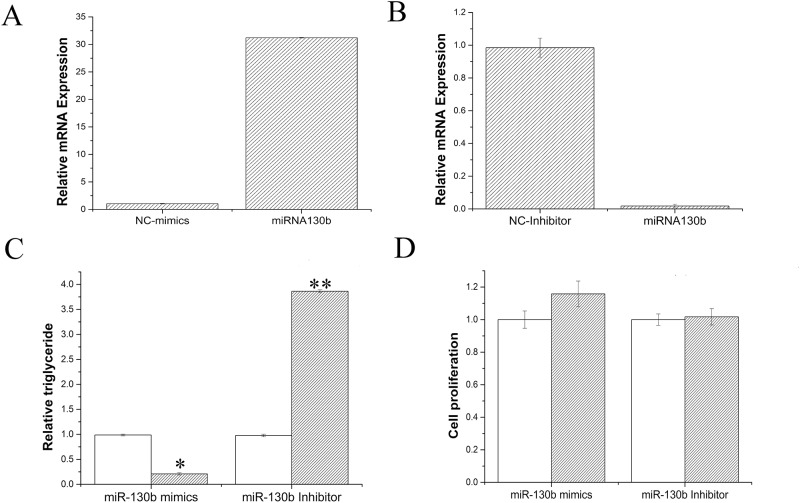
Fig 2. miR-130b suppresses Lipid metabolism in GMECs.
A: miR-130bmimic treatment (60nM); B: miR-130b inhibitor treatment (60nM); C: Triglyceride levels in cells transfected with miR-130b mimic or inhibitor; Triglyceride levels were compared with that of control (n = 6). White bars, negative control; black bars, miR-130b mimic or inhibitor. D: Cell proliferation levels in GMECs. White bars, negative control; black bars, miR-130b mimic or inhibitor. All experiments were performed in duplicate and repeated three times. Values are presented as means ± standard errors, *, P<0.05; **, P<0.01.

