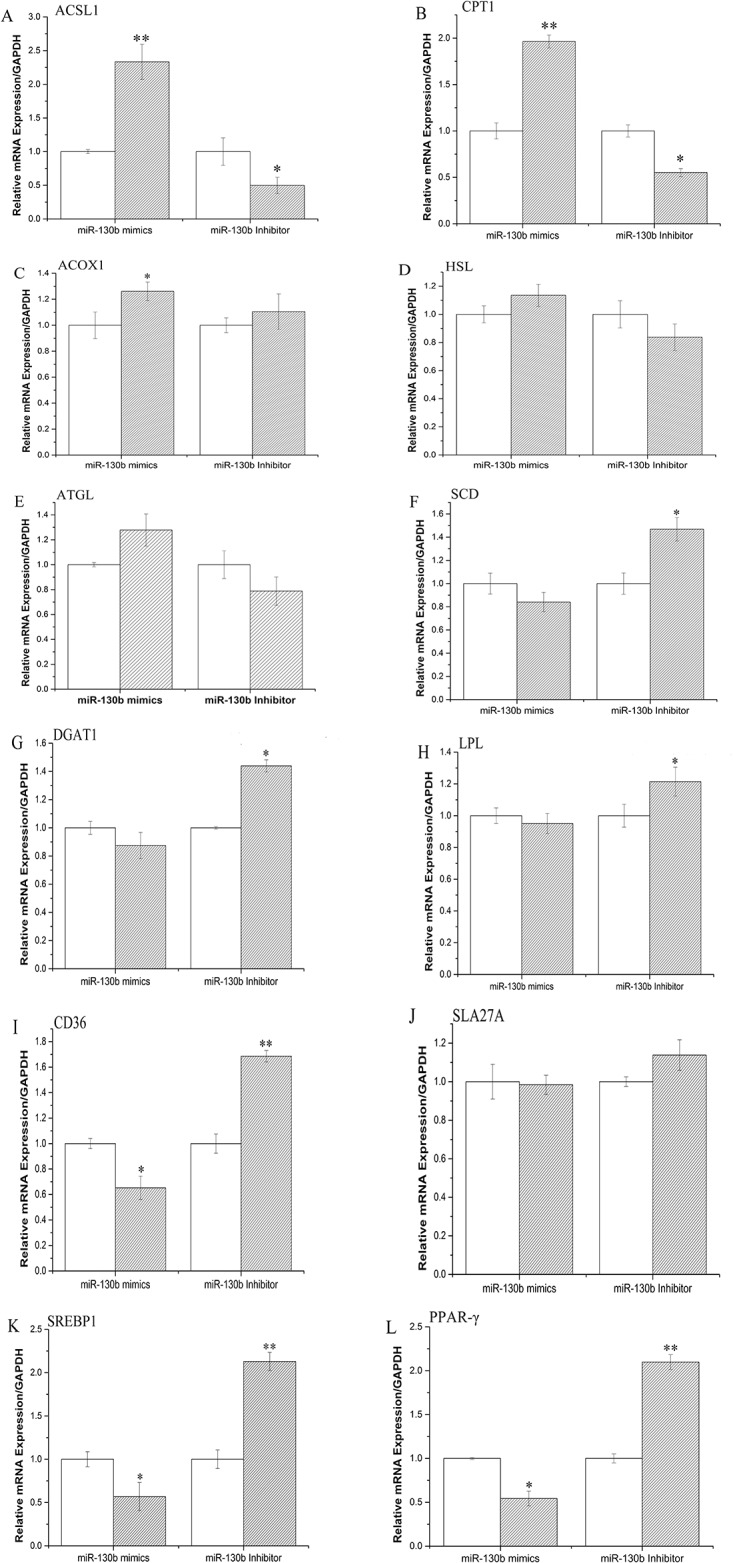
Fig 4. Expression of fat metabolism related genes.

GMECs were transfected with miR-130b mimic or inhibitor for 48h, the mRNA expression of ACSL,CPT, ACOX1, HSL, ATGL, SCD, DGAT1, LPL, CD36, SLA27A6, SREBP1 and PPARγ were quantified by RT-qPCR (n = 6). White bars, negative control; black bars, miR-130b mimic or inhibitor. All experiments were performed in duplicate and repeated three times. Values are presented as means ± standard errors, *, P<0.05; **, P<0.01.
