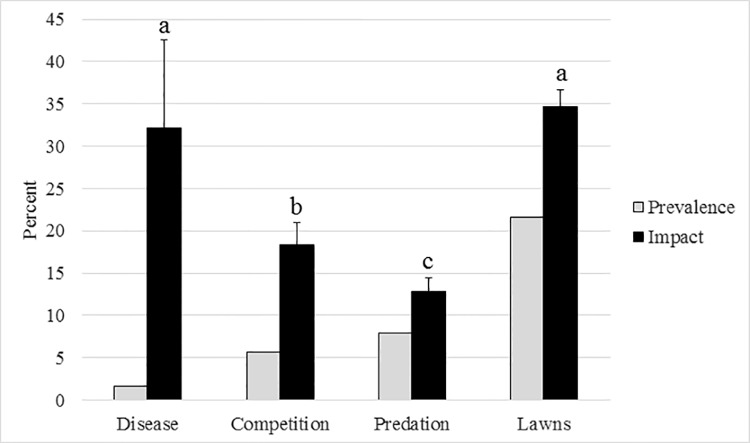
Fig 4. Prevalence of sources of coral mortality (gray bars) and severity of impacts expressed as the mean percentage of tissue mortality on A. cervicornis colonies (black bars ± SE).
Letters reference statistical difference in the mean percentage of tissue mortality of each coral colony affected by mortality between sources (one-way ANOVA; p<0.001).

