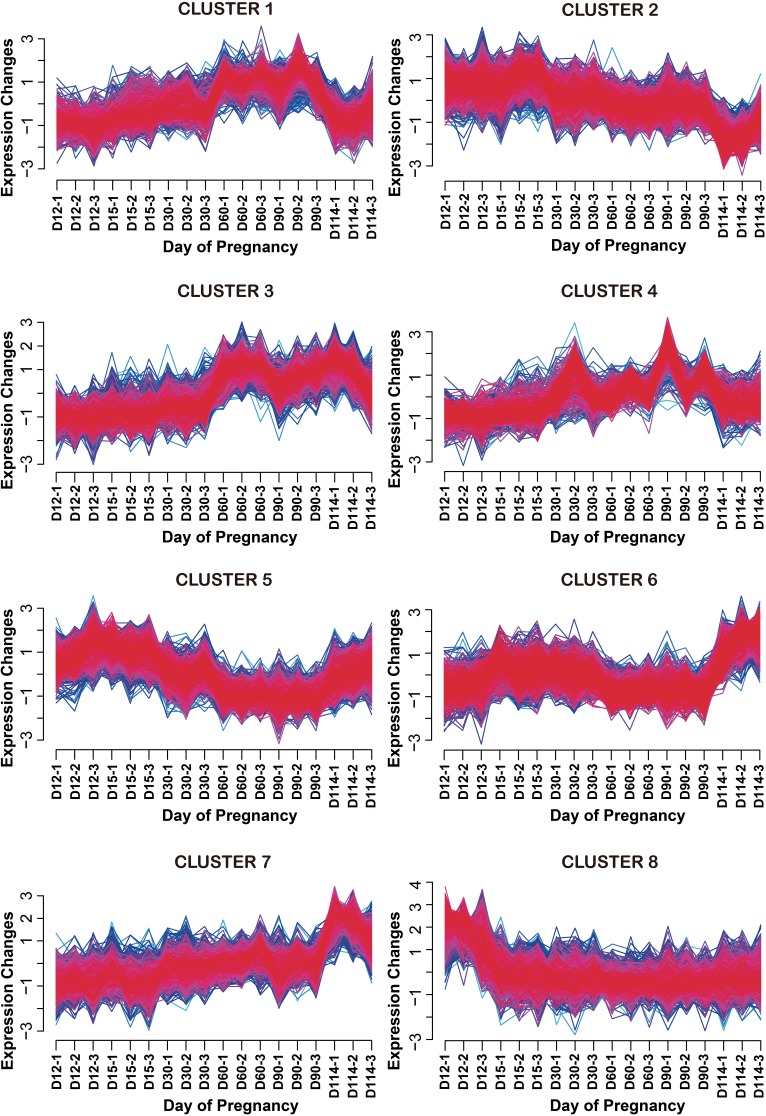
Fig 2. Clustering analysis of differentially expressed genes in the uterine endometrium during pregnancy in pigs.
Clustering analysis was performed using the Mfuzz package and dendrograms of each cluster are depicted. The fuzzy c-means (FCM) clustering algorithm, which is a part of the package, uses a soft partitioning clustering method that requires two main parameters (c = number of clusters, m = fuzzification parameter). In this analysis, the optimal values of c and m were derived by the iterative refinement procedure. Through this optimization, two parameters were calculated as c = 8 and m = 1.25. As a result, eight clusters were obtained. Yellow or green lines correspond to genes with a low membership value; red and purple lines correspond to genes with a high membership value. Most genes included in this figure showed a high membership value.

