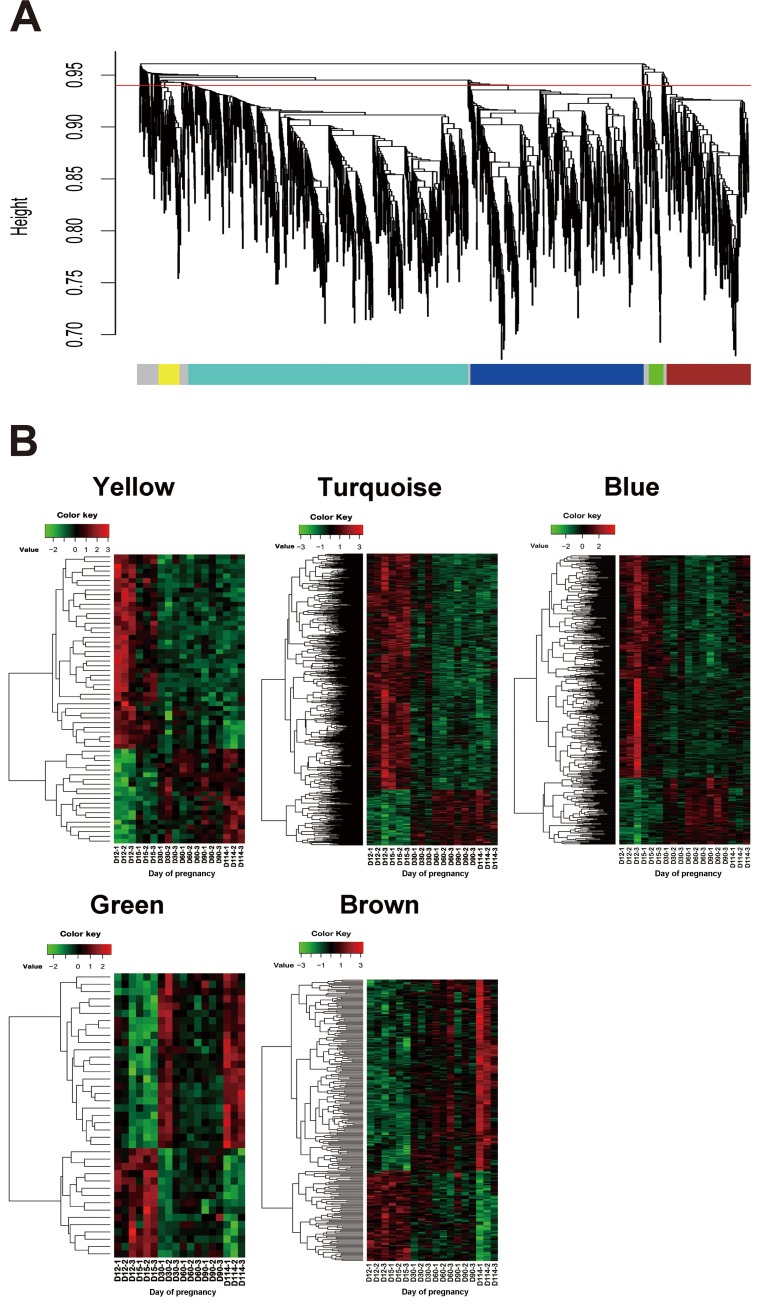
Fig 3. Network analysis of gene expression in the porcine uterine endometrium during pregnancy to identify distinct modules of weighted coexpressed genes.
(A) Dendrograms produced by average linkage hierarchical clustering of 24,123 genes based on topology overlap. The red line indicates the height at which the tree was cut (0.94, red line) to define the module. Different modules were assigned colors as indicated in the horizontal bar beneath the dendrogram. (B) Heatmap images of all genes involved in 5 network modules. Columns represent probe identifications and putative annotations, and rows represent day of pregnancy. Red indicates high levels of expression and green indicates low levels of expression.

