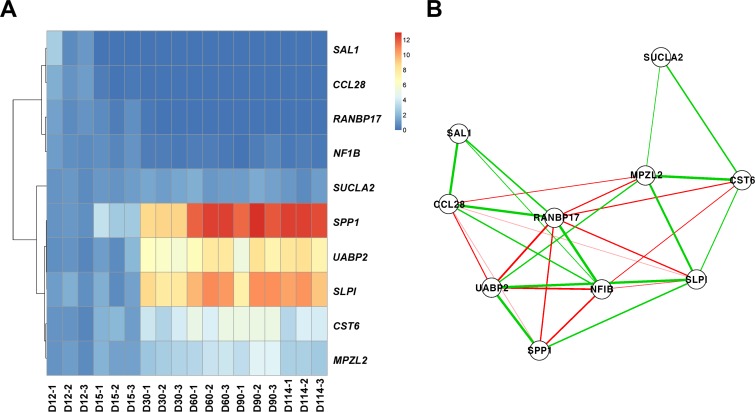
Fig 4. Real-time RT-PCR analysis to technically validate hub genes and correlated genes.
(A) Heatmap with hierarchical clustering using 2-ΔΔCT values of 10 genes in real-time RT-PCR. (B) Correlation-based network plot. The edges represent significant correlation (FDR adjusted P-values < 0.05 in Pearson correlation test), and green and red colors represent positive and negative correlation, respectively.

