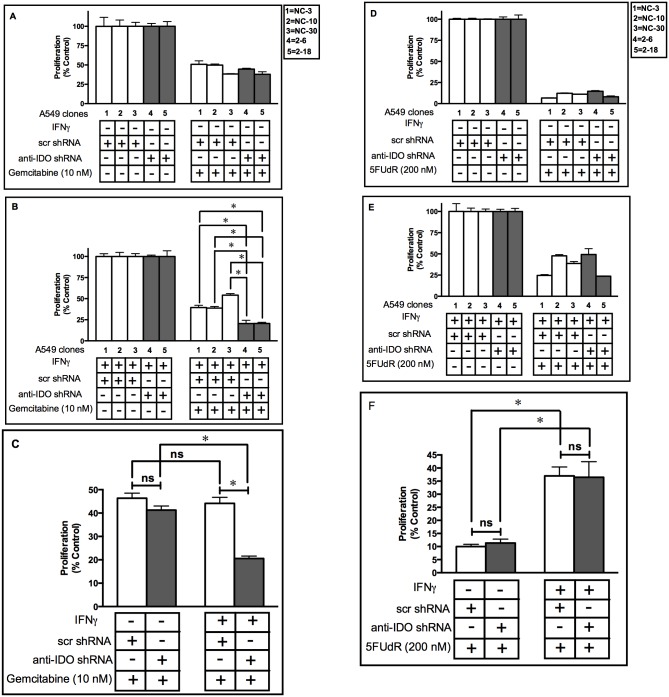
Fig 5. A549 clone sensitivity to Gemcitabine and 5FUdR before and after IDO induction.
Proliferation of each of 5 individual A549 cell clonal populations before (Panel A and C) and after (Panel B and C) IDO induction with IFNγ. A549 clonal populations were cultured with or without IFNγ (25 ng/ml) for 48 h, treated with gemcitabine (10 nM) for 72 h, and then enumerated. White bars: A549 clones transfected with scrambled, non-targeting control shRNA. Gray bars: A549 cells transfected with anti-IDO shRNA. Each bar represents a mean of 9 (white bars) or 6 (black bars) values ± SD for Panels A and B and SEM for panel C, (*p<0.05). Results are normalized to control cells not treated with Gemcitabine, without (panel A) or with (panel B) IFNγ treatment. Panels D-F: Proliferation of each of 5 individual A549 cell clonal populations before and after IDO induction with IFNγ. A549 clonal populations were cultured with or without IFNγ (25 ng/ml) for 48 h and, 5FUdR (200 nM) for 72 h, and then enumerated. White bars: A549 clones transfected with scrambled, non-targeting control shRNA. Gray bars: A549 cells transfected with anti-IDO shRNA. Each bar represents a mean of 9 (white bars) or 6 (black bars) values ± SD for Panels D and E and SEM for panel F ± SD. *Significant difference, Student's t-test, p<0.05. Results are normalized to control cells not treated with 5FUdR, without (panel A) or with (panel B) IFNγ treatment.

