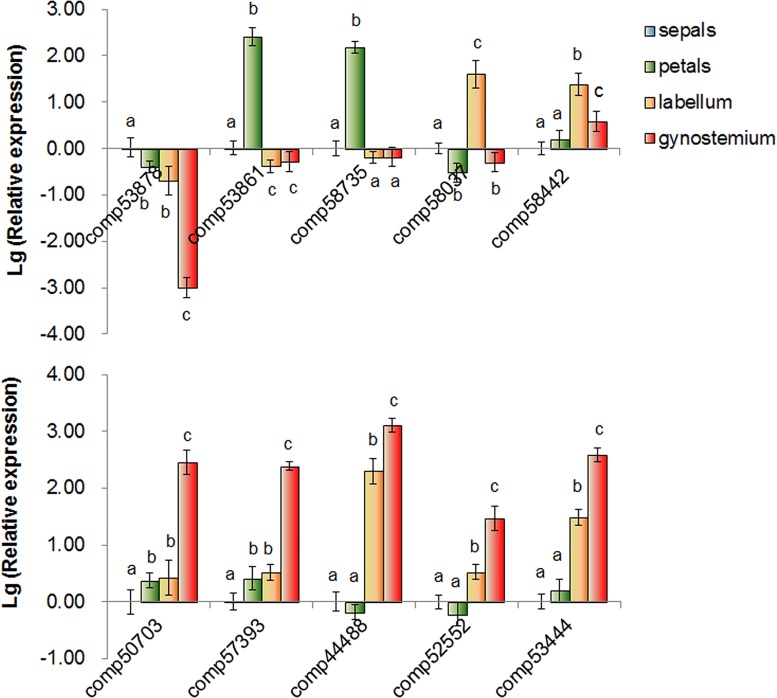
Fig 9. The quantitative RT-PCR analysis of gene expression in sepals, petals, labellums and gynostemiums.
The y-axis indicates fold change in expression among the samples. The Lg (Relative Quantitation) of the genes in the sepals was calibrated as zero. Error bars indicate the standard deviation of the mean (SD) (n = 3). Three replicates were analyzed, with similar results. a, b, and c, d, one way ANOVA with Bonferroni multiple comparison test significant at P<0.05 between two of the individual floral organs sepal, petal, Labellum, gynostemium.

