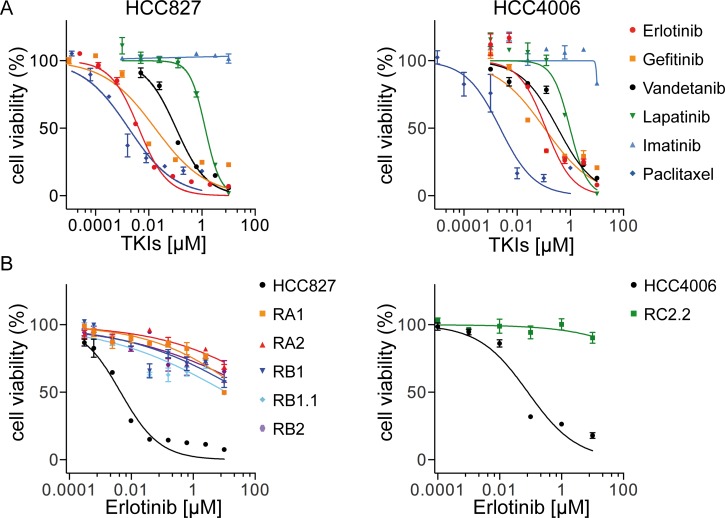
Fig 1. Cell inhibition growth analysis of ERL-resistant NSCLC cell lines.
A) Representative dose-effect curve plots of HCC827 and HCC4006 parental cell lines to the indicated TKIs. Cell viability was determined by MTT assays. The results are expressed as the percentage of cell viability in drug-treated cultures relative to DMSO-treated control samples; B) Dose effect curve plots of derived ERL-resistant HCC827 and HCC4006 cell lines. The results are expressed as described above. Data (mean ± s.e.m) in A and B are representative of more than three independent experiments.

