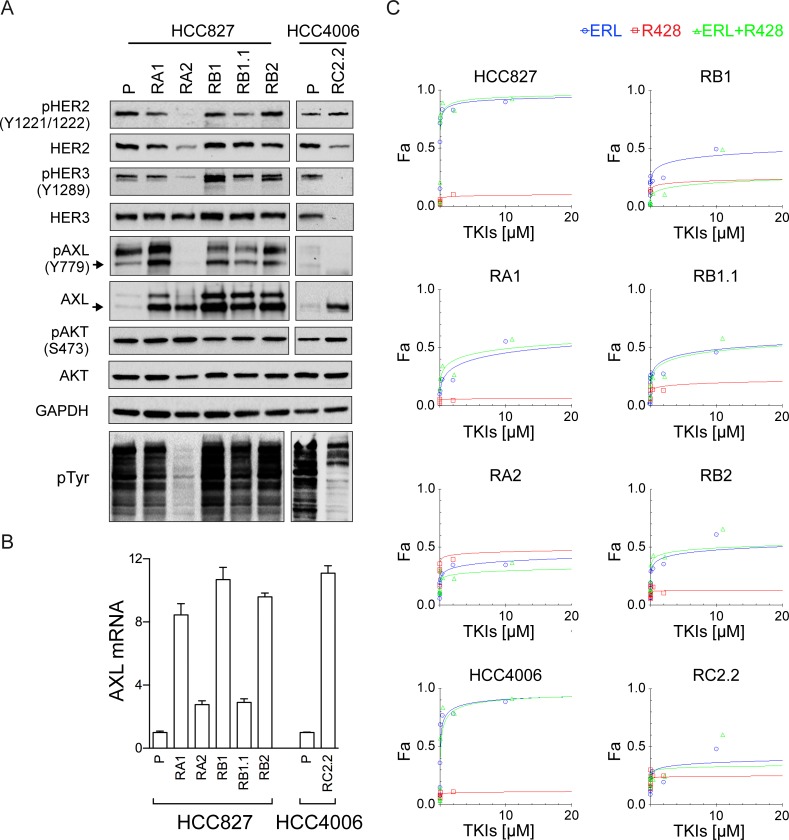
Fig 5. HER2/HER3 and AXL expression and phosphorylation analysis.
A) Representative western blots of total cell lysates of HCC827 and HCC4006 parental cell lines (P) and their derived ERL-resistant cell lines. Arrows indicate the expected molecular weight size. Total cell lysates loaded were 40 μg for AXL and pAXL analyses and 25 μg for the others. B) qPCR analysis of AXL mRNA normalized to rp-L31 mRNA and expressed relative to the levels in parental cell lines set as 1 (mean ± SD of triplicate determinations). Western blots and qPCR data are representative of those obtained respectively from 3 and 2 independent analysis. C) Dose-effect curves were calculated using CompuSyn software and plotting the entered Fa values against the entered dose values. For combination treatments, the combined drugs dose was entered. Each data point represents the mean of 3 replicates.

