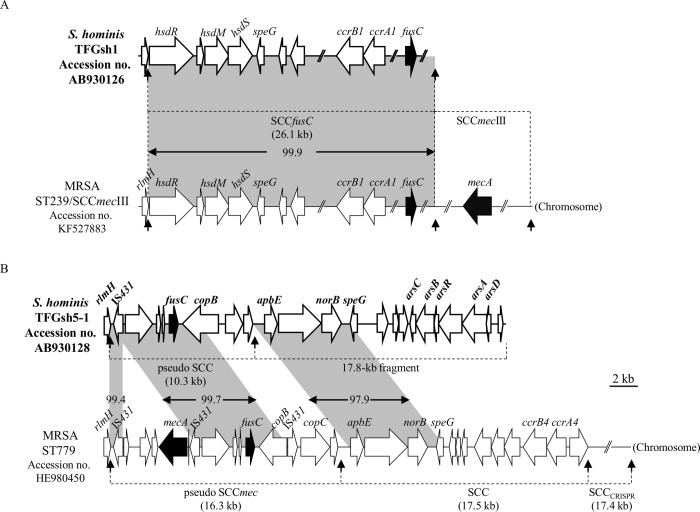
Fig 2. Genetic organization of fusC-related elements in S. hominis subsp. hominis.
(A) Schematic maps of SCCfusC in strain TFGsh1 and (B) the composite SCC structure in strain TFGsh5-1 are shown. The ORFs are shown as arrows, and the drug resistance genes fusC and mecA are shown as black arrows. The homologous regions are shaded, and the numbers in the shadow show the percent homology. The att sequence is indicated by vertical arrows.

