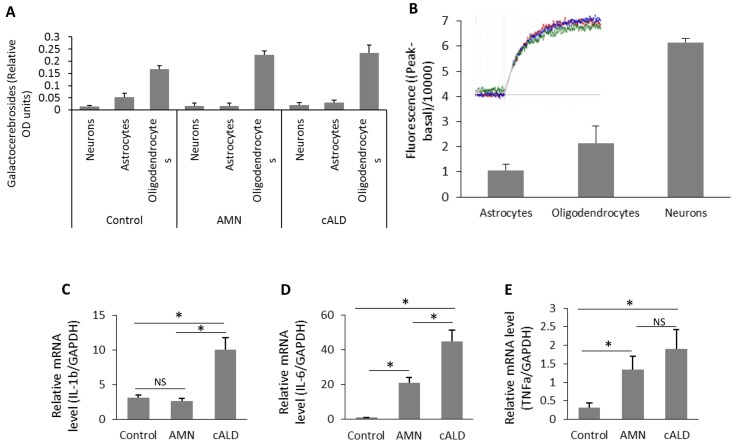
Fig 5. Biochemical characterization of IPSC-derived Ast, neurons and OLs.
(A) Quantification of the OLs marker: galactocerebrosides purified from OLs, neurons and Ast by densitometric scanning in Control, AMN and cALD cells. (B) Quantification of the fluorescence (n = 2) related to calcium influx stimulation by glutamate in control cells (neurons, OLs and Ast). (C-D) quantification of mRNA levels of IL-1β, TNFα and IL-6 in Control, AMN and cALD Ast by RT-qPCR (n = 3; n is the number of independent measurements from independent preparation of cells). mRNA levels were standardized with mRNA level of the GAPDH. Data are represented as mean±SD. *P<0.05; **P<0.01

