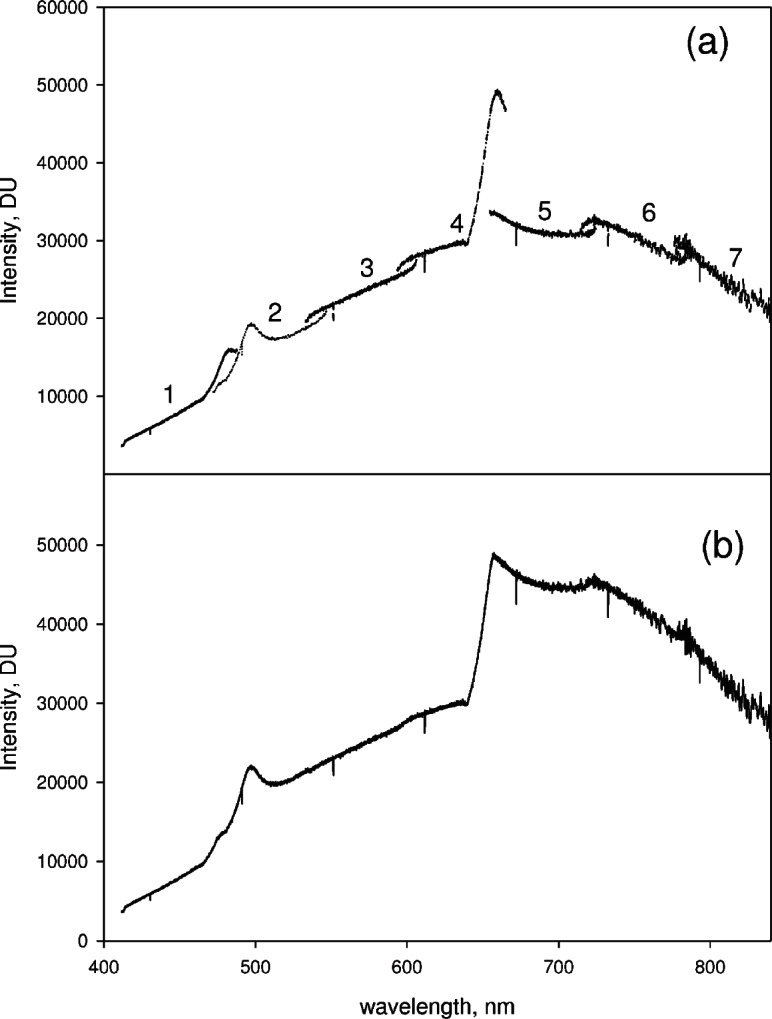
Fig. 2.

(a) The solid traces show seven partial spectra from a reference irradiance lamp taken with a CCD array spectrometer set at seven different central wavelengths. The regions near 490 nm and 660 nm exhibit different response for each of the overlapping partial spectra. The differences can be attributed to dependence of the grating efficiency on grating angle at the blaze angle (515 nm) and at the Wood’s anomaly (660 nm). (b) The solid trace shows the extended spectrum which was obtained by splicing the seven partial spectra shown in (a). The splicing was performed by requiring continuity at the midpoint of the overlap region between any two partial spectra. There are significant artifacts exposed by the splicing procedure. Figures 3 and 4 and the accompanying text discusses the splicing procedure and how to remove the artifacts exposed by splicing.
