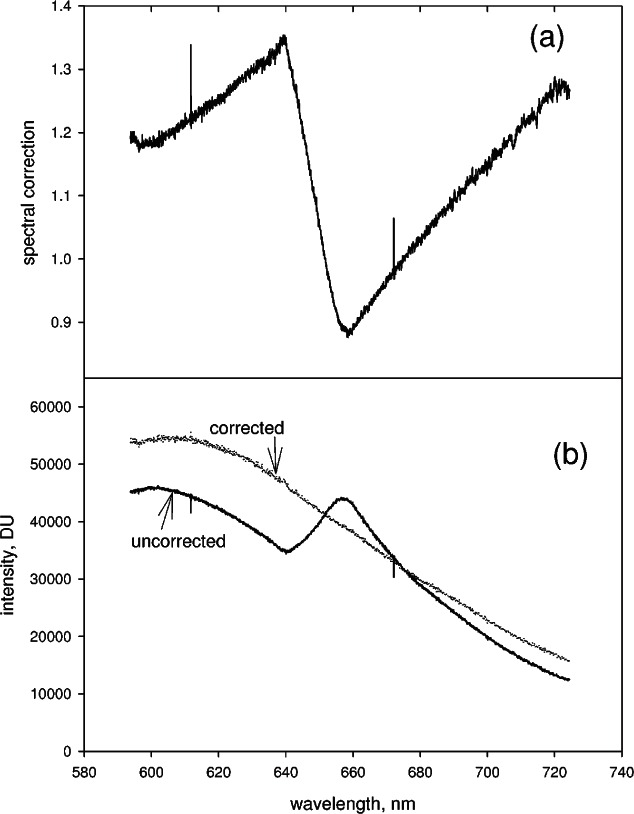
Fig. 4.
(a) The solid trace shows the spectral response correction factor. To obtain this trace, first, the partial spectra shown in Fig. 3b were spliced and normalized by dividing all of the values in the spliced spectrum by the value a 670 nm. Second, the calibrated irradiance values of the reference lamp were normalized by the value at 670 nm. The solid trace shows the normalized irradiance values divided by the values of the normalized spliced spectrum. This ratio constitutes the spectral correction factor. (b) The solid trace in Fig. 4b shows the spliced spectrum resulting from joining PS4 and PS5 in Fig. 3a. Multiplying the uncorrected spliced spectrum by the spectral correction factor, shown in (a), results in the corrected spectrum shown by the dotted line in Fig. 4b. The correction for spectral response eliminates artifacts exposed by the splicing procedure.

