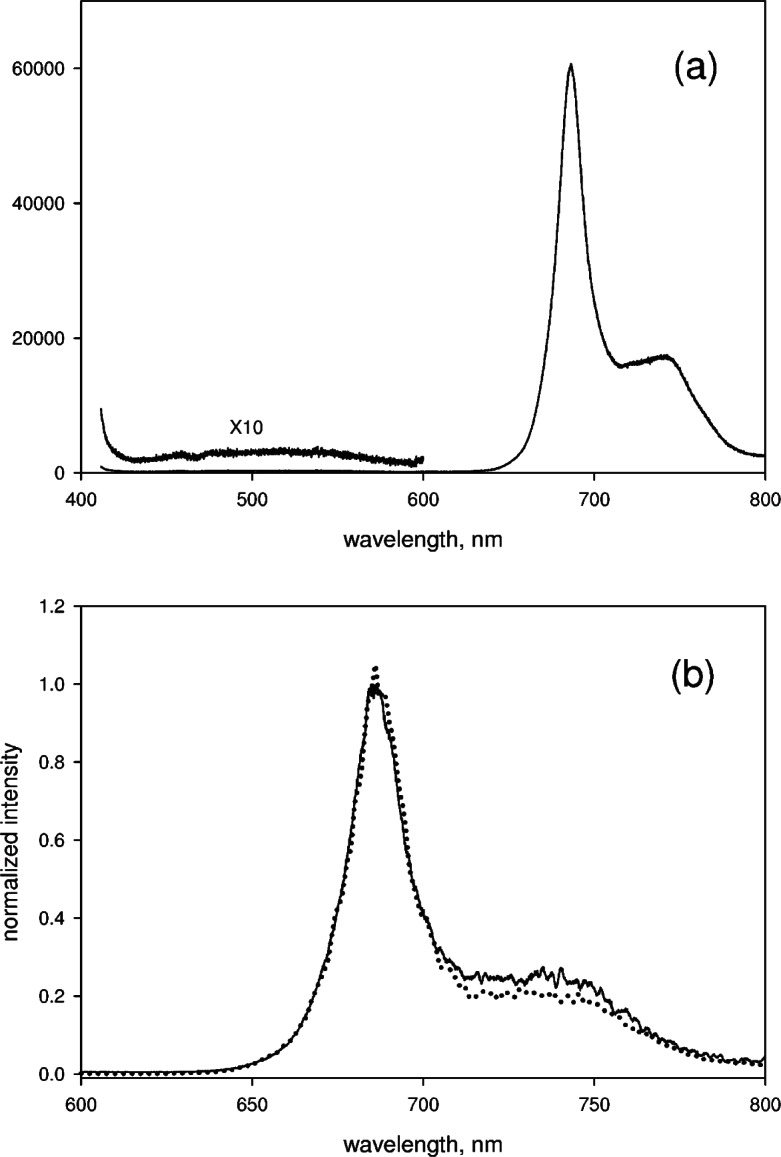
Fig. 8.

(a) The solid trace shows the measured signal from a cuvette filled with a suspension of microalgae and irradiated with a 404 nm laser line. The spectrum was corrected for background and for relative spectral response. The background was measured separately using a cuvette filled with the growth medium and the spectral response correction was determined using a reference lamp. The inset shows a portion of the spectrum magnified 10 times. The increase in the intensity at 410 nm is due to scattering from the microalgae. (b) The solid trace shows the emission spectrum from the algal suspension with background correction and spectra response correction using the SRM 2490 orange glass. The dotted lines show the emission spectrum from the algal suspension measured on a scanning spectrometer. The slight difference at 740 nm could be due to different illumination in the two instruments (discussed in text). The uncertainty in the measured normalized intensity was about 0.02 (a value obtained from the fluctuations of the normalized intensity).
