
Figure 4.
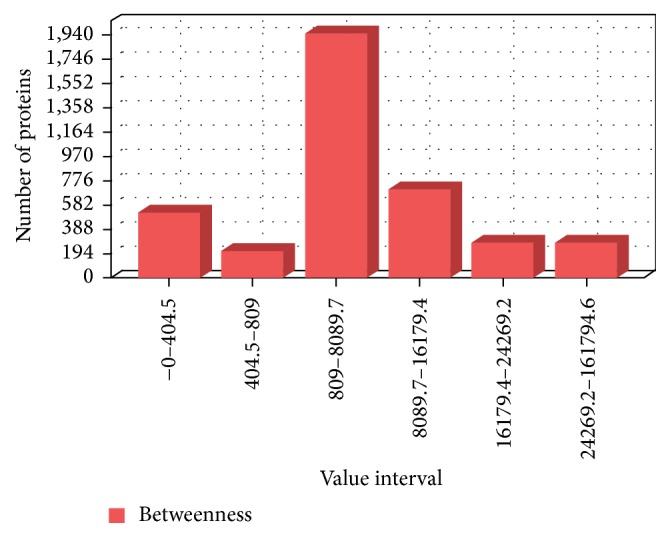
Distribution of betweenness centrality values. Longitudinal comparison of centrality values which shows the number of proteins located in separate score intervals based on betweenness centrality measure.
Official websites use .gov
A
.gov website belongs to an official
government organization in the United States.
Secure .gov websites use HTTPS
A lock (
) or https:// means you've safely
connected to the .gov website. Share sensitive
information only on official, secure websites.
Distribution of betweenness centrality values. Longitudinal comparison of centrality values which shows the number of proteins located in separate score intervals based on betweenness centrality measure.