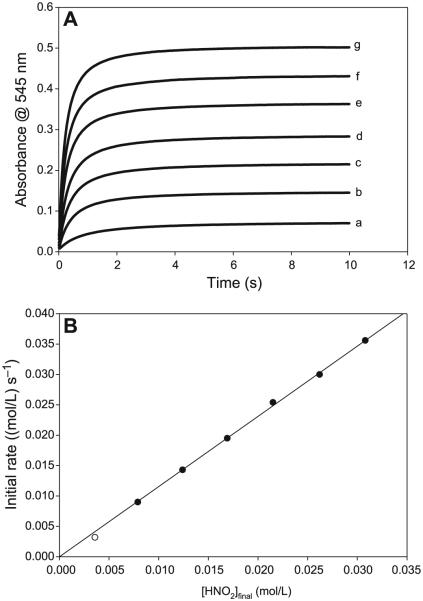
Fig. 11.
(A) Evaluation of unambigous nitrous acid dependence by employing [H+]0 = [NO2−]0 and varying both at the same equimolar concentrations. [CA]0 fixed at 0.25 mol/L. (a) [H+]0 = [NO2−]0 = 0.005 mol/L, (b) [H+]0 = [NO2−]0 = 0.010 mol/L, (c) [H+]0 = [NO2−]0 = 0.015 mol/L, (d) [H+]0 = [NO2−]0 = 0.020 mol/L, (e) [H+]0 = [NO2−]0 = 0.025 mol/L, (f) [H+]0 = [NO2−]0 = 0.030 mol/L, and (g) [H+]0 = [NO2−]0 = 0.035 mol/L. (B) Plot of initial rate of nitrosation versus initial nitrous acid concentrations as calculated in Table 2 and derived from the data in Fig. 11A. This plot is linear, as opposed to Fig. 6C.

