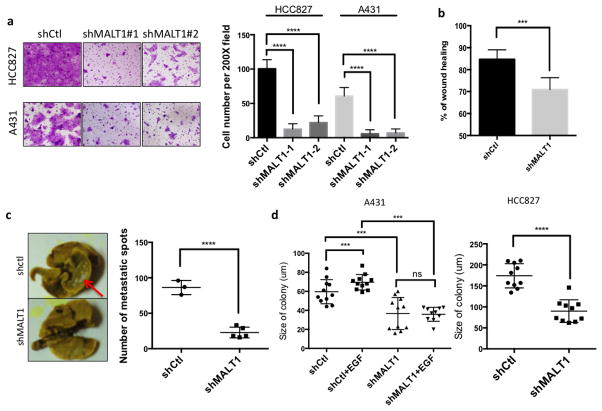
Figure 3. MALT1 contributes to EGFR-associated malignancy.
(a) A431 and HCC827 cells with a MALT1 knockdown (shMALT1#1 and shMALT1#2) or a control knockdown (shCtl) were analyzed by transwell migration assays. Cells were fixed and stained 20 hours after seeding (left panel). Cell numbers in five random fields were calculated and compared (right panel). (b) MALT1 silenced A431 cells and controls were analyzed by a wound-healing assay in the presence of EGF (1 ng/ml). The percentage of wound closure were calculated and analyzed. (c) MALT1 silenced A431 cells and controls were intravenously injected into SCID mice. Four weeks after injection, mice were sacrificed and the lungs were washed, fixed and stained with Bouin solution. Metastasis sites were visualized as white spots (left panel) and quantitated (right panel). (d) A431 (left) and HCC827 (right) cells with a MALT1 knockdown (shMALT1) and control cells (shCtl) were subjected to soft agar colony formation analysis with or without EGF (2ng/ml). The sizes of cell colonies were calculated and analyzed.

