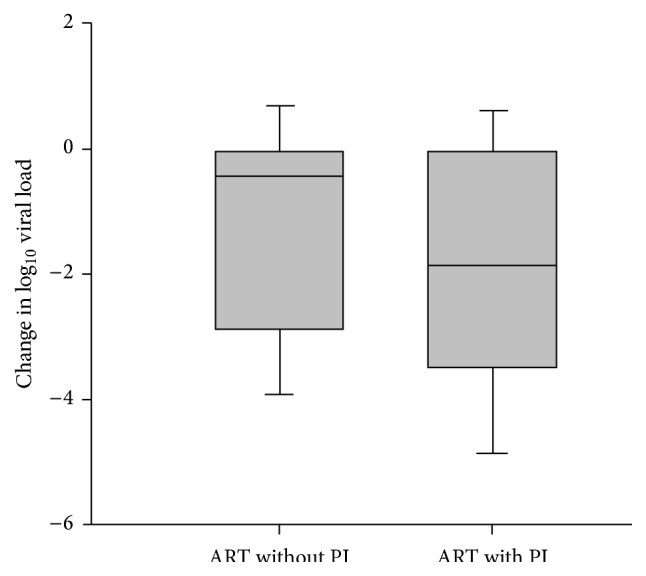
Figure 1.

Change in viral load during pregnancy for women receiving ART with and without a protease inhibitor. Shaded area represents one standard deviation from the mean, which is denoted as the black line. Whiskers represent two standard deviations from the mean. The change in log10 viral load is significantly greater for ART with a protease inhibitor (PI) using the Student-Newman-Keuls test, p < 0.001.
