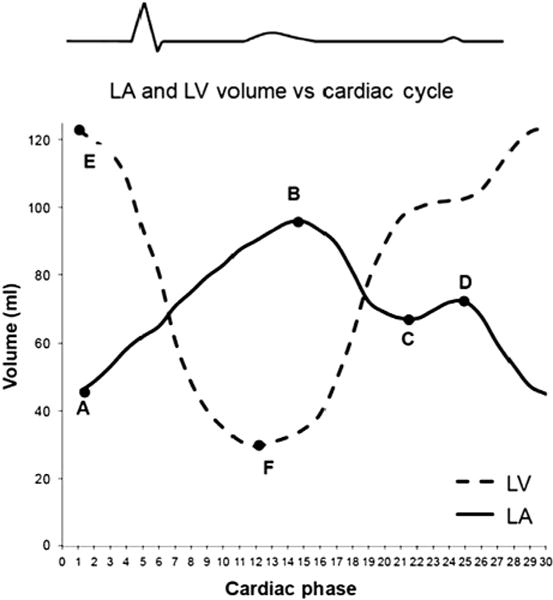
Figure 1.

LA and LV volume versus cardiac cycle curves. The curve with A, B, C, and D represents a normal LA volume curve. Point A = minimal LA volume (LAmin); point B = maximal LA volume (LAmax); point C = relative minimal LA volume (LArel max); point D = relative maximal LA volume (LArel min). The curve with E and F represents a normal LV volume curve. Point E = LV end-diastolic volume; point F = LV end-systolic volume. LVSV = E−F; LA reservoir volume = B−C; LA booster pump volume = D−A; LA conduit volume = LVSV−LA reservoir volume−LA booster pump volume. LA, Left atrium; LV, left ventricular.
