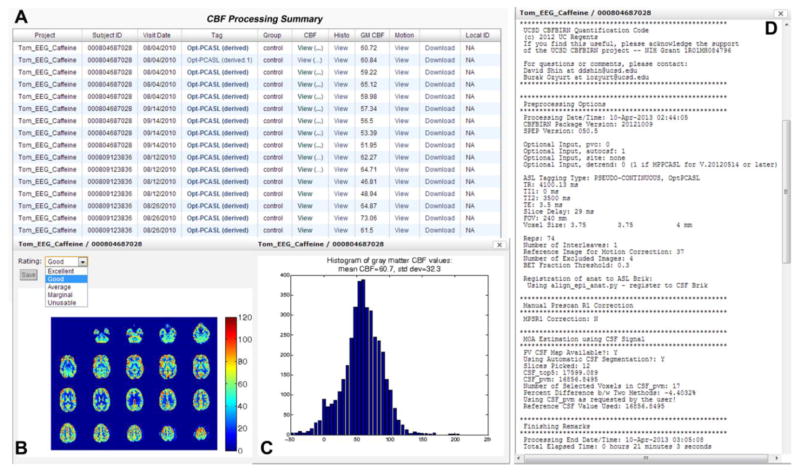
Figure 2.
CBF Processing Summary Page that presents a table (A) containing the complete list of successfully processed jobs. For each job, the table provides additional details such as Subject ID, scan date, experimental condition, type of ASL used, and whole-brain mean gray matter CBF value. A CBF map (B), a histogram of gray matter CBF values (C), and detailed processing logs (D) are shown from a representative job, all of which are accessible directly from the table.

