Figure 1.

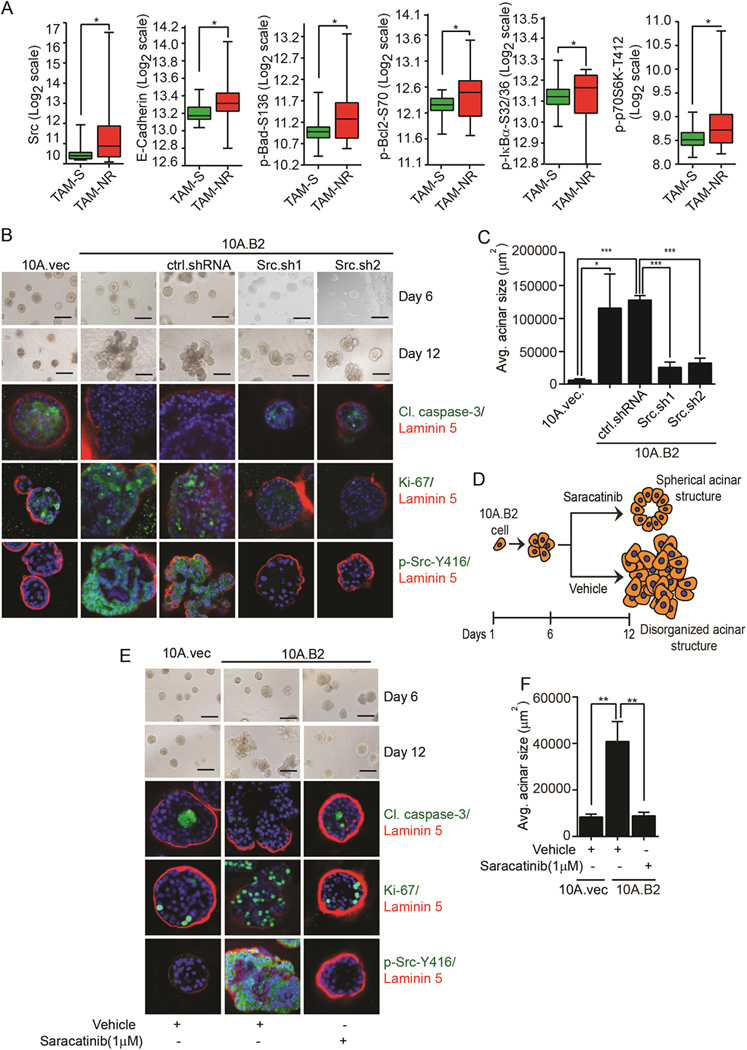
Elevated Src expression in Tam-NR premalignant lesions from patients and effects of targeting Src on disorganized acini formation of ER−, Src-activated MECs. A, Protein markers with statistically significant differences in their central tendencies between the Tam-S and Tam-NR groups. B, Phase-contrast images of 10A.vec, 10A.B2, ctrl.shRNA, and Src.sh clones of 10A.B2 cells in 3D culture. IF images showing cleaved caspase-3, Ki-67, phospho-Src-Y416, laminin 5, and DAPI staining in acini. C, Quantification of average (avg.) acinar size. D, Schematic showing the effect of vehicle and saracatinib on the acinar growth of HER2-overexpressing MECs in the prevention setting. E, Phase-contrast images of 10A.vec, vehicle- and saracatinib-treated 10A.B2 cells. IF images showing cleaved caspase-3, Ki-67, phospho-Src-Y416, laminin 5, and DAPI staining in acini. F, Quantification of avg. acinar size (scale bar = 200 µm).
