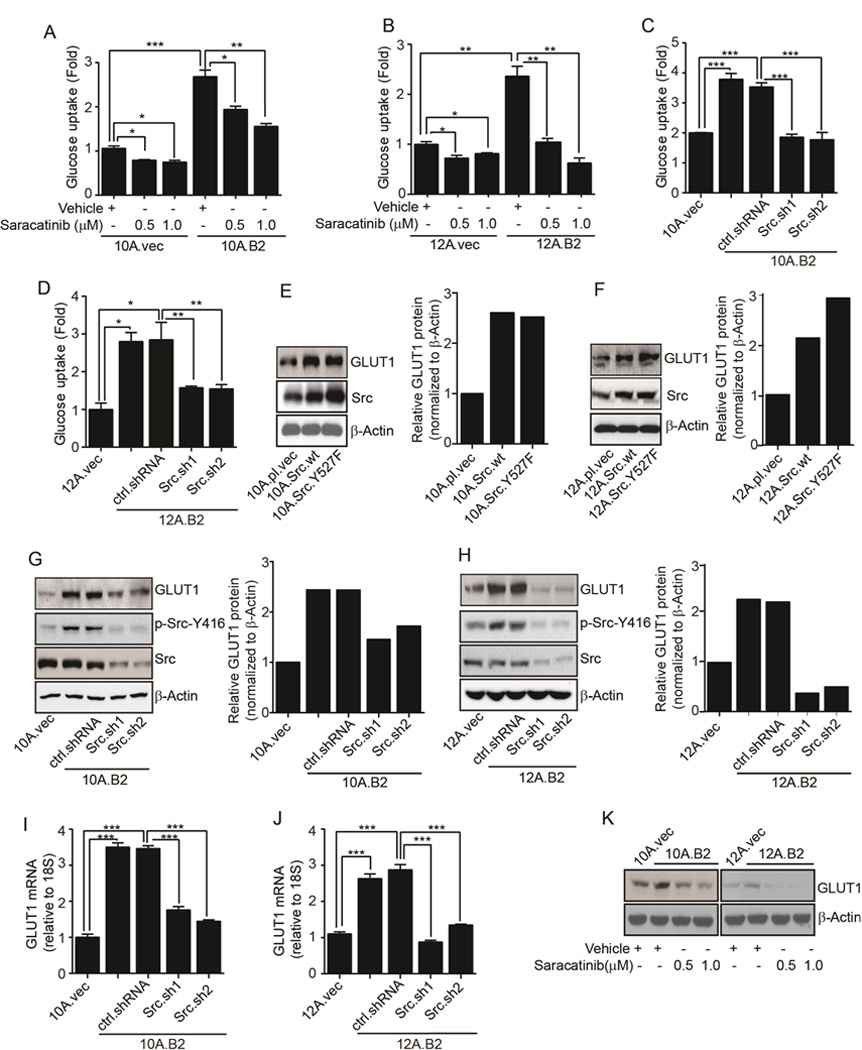
Figure 3.

Src regulates glucose uptake and GLUT1 expression. A & B, Glucose uptake in vector control, 10A.B2, and 12A.B2 cells treated with vehicle or saracatinib. C & D, Glucose uptake in vector control, ctrl.shRNA-, and Src.sh-transfected 10A.B2 and 12A.B2 cells. E&F, Immunoblots and respective quantifications showing GLUT1 and Src expression in vector-, Src wt-, and SrcY527F-expressing MCF10A and MCF12A cells in 3D culture. G&H, Immunoblots and respective quantifications showing GLUT1, phospho-Src-Y416, and Src in vector control, 10A.B2, 12A.B2, ctrl.shRNA-, and Src.sh-clones of 10A.B2 and 12A.B2 cells grown in 3D culture. I&J, qRT-PCR showing GLUT1 in vector control, 10A.B2, 12A.B2, ctrl.shRNA and Src.sh clones of 10A.B2 and 12A.B2 cells grown in 3D culture. K, Immunoblot showing GLUT1 in vehicle- and saracatinib-treated 10A.B2 and 12A.B2 cells grown in 3D culture.
