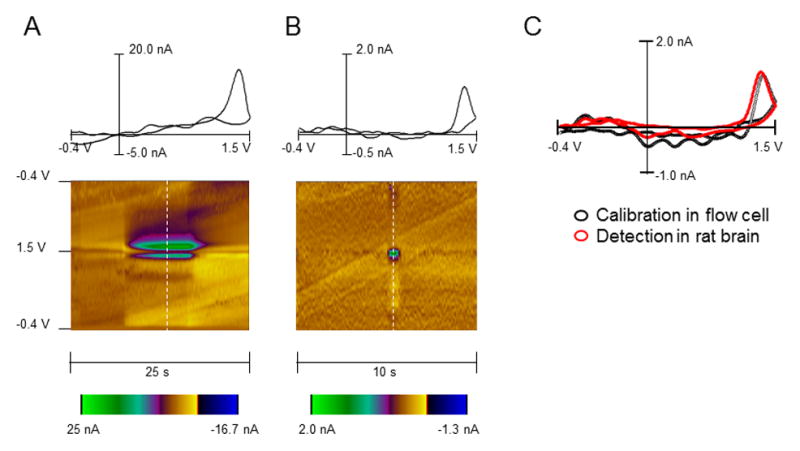
Figure 1. Identification of adenosine in vitro and in vivo using fast scan cyclic voltammetry.

(A) In vitro calibration of the carbon fiber electrode to adenosine at a concentration of 1.0 μM in the flow cell. A 2D color plot (bottom) shows time on the abscissa, potential on the ordinate and current in false color. The dashed white line on the color plot indicates where the background subtracted voltammogram (on top of color plot) was obtained. (B) In vivo spontaneous adenosine release detected in the rat striatum. The cyclic voltammogram and 2-D color plot match the in vitro calibration. The maximal oxidation for each case occurs at 1.4 V. (C) Cyclic voltammograms obtained for adenosine during an electrode calibration in a flow cell (black circles) and during recordings in vivo (red circles). The voltammograms with the same maximal current at 1.4 V were selected to demonstrate identical electrochemical features of signals.
