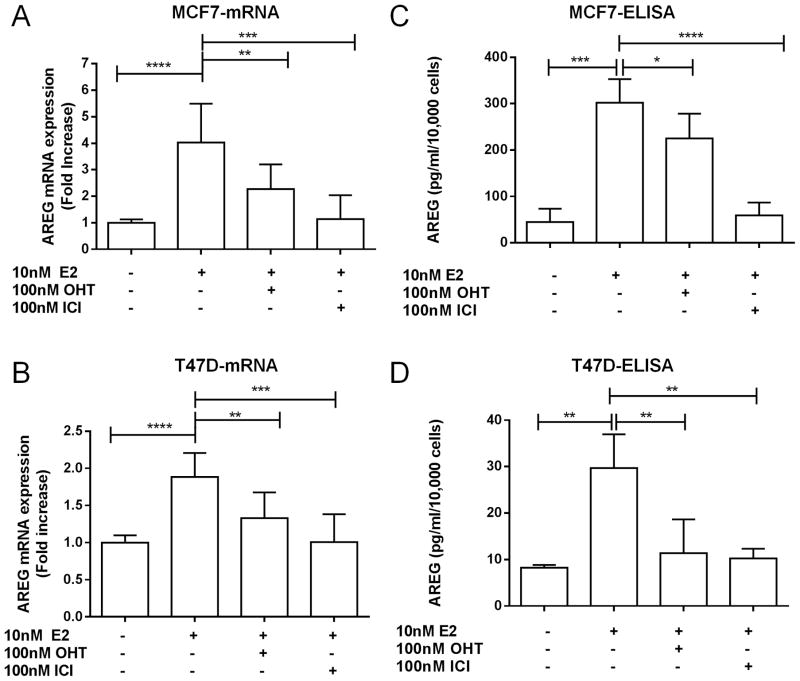
Figure 2.
Amphiregulin expression is induced by estrogen and suppressed by ERα antagonists. A, Quantitative RT-PCR analysis of AREG mRNA levels in MCF7 cells treated with estrogen (E2) alone, or supplemented with 4-hydroxytamoxifen (OHT) or fulvestrant (ICI) at the indicated concentrations. B, Quantitative RT-PCR analysis of AREG mRNA levels in T47D cells treated as described in A. C (MCF7) and D (T47D), ELISA analysis of soluble AREG protein production by cell lines treated as indicated in A. Error bars represent standard deviation. *p ≤ 0.05, **p ≤ 0.01 ***p ≤ 0.001,****p ≤ 0.0001.

