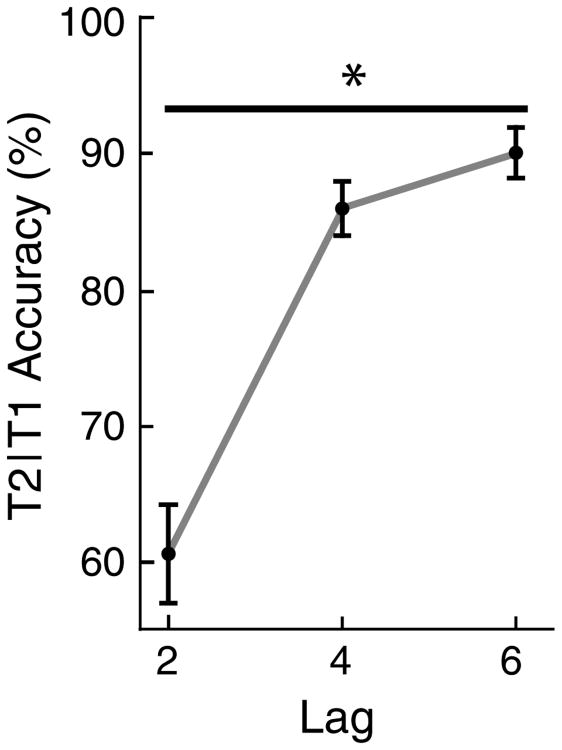
Fig. 2.
Mean (n = 17) report accuracy for T2 on trials in which T1 was reported correctly for the Lag 2 (M = 60.72 %, SE = 3.69 %), Lag 4 (M = 86.06 %, SE = 2.30 %), and Lag 6 (M = 89.88 %, SE = 2.20 %) conditions. Standard errors are indicated by the vertical bars. A significant linear trend was observed across all three lag conditions

