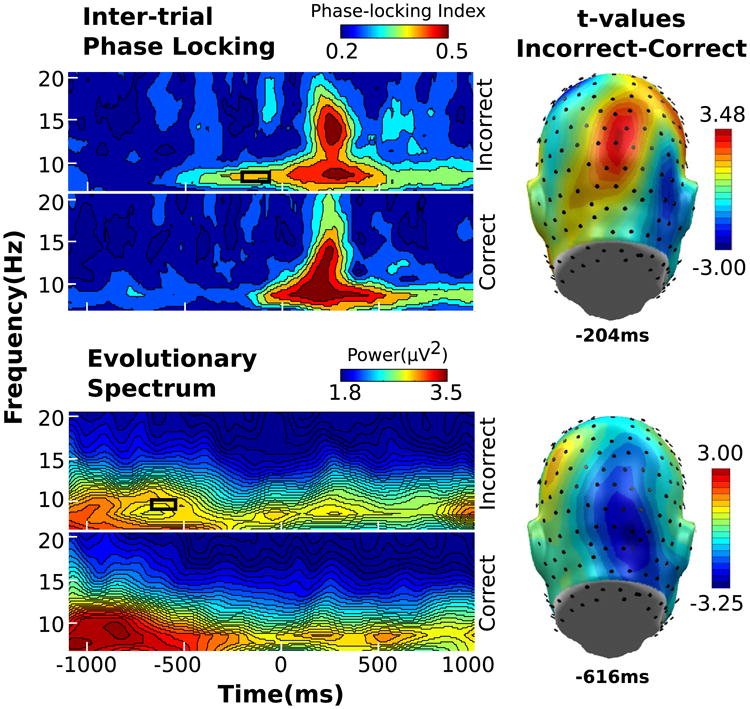
Fig. 3.

Wavelet illustrations for ITPL (left, top), power (left, bottom), for frequencies 6.73–20.50 Hz from −1100 to 1104 ms relative to T1 onset from one representative sensor, with time periods of significant incorrect versus correct differences indicated by the black box. Topographical distribution of t values (right) taken at the time point containing the maximum t value
