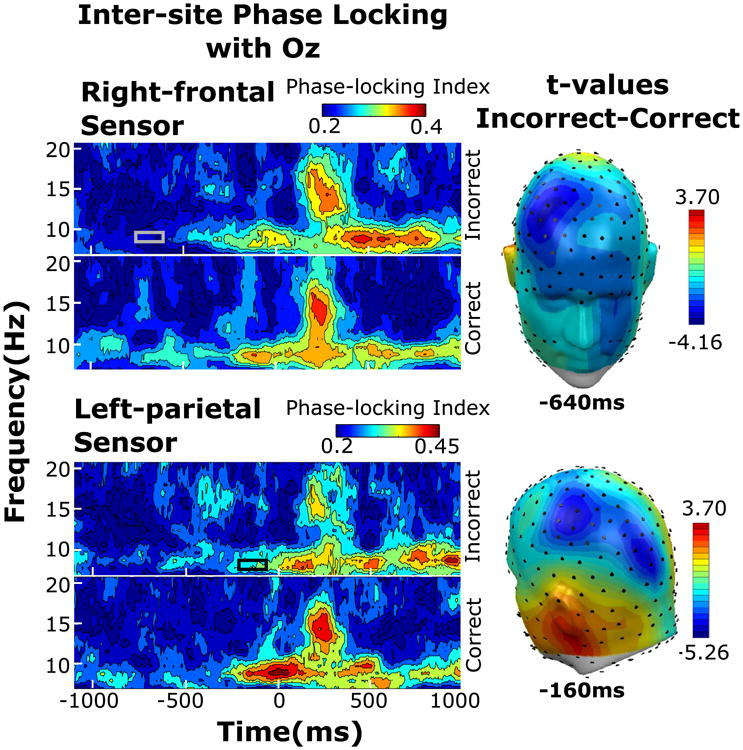
Fig. 4.

Wavelet illustrations for ISPL taken from one representative sensor within the right frontal (left, top) and right parietal (left, bottom) for frequencies 6.73–20.50 Hz from −1100 to 1104 ms relative to T1 onset from one representative sensor, with time periods of significant incorrect versus correct differences indicated by the gray or black box. Topographical distribution of t values (right) taken at the time point containing the maximum t value for either sensor cluster
