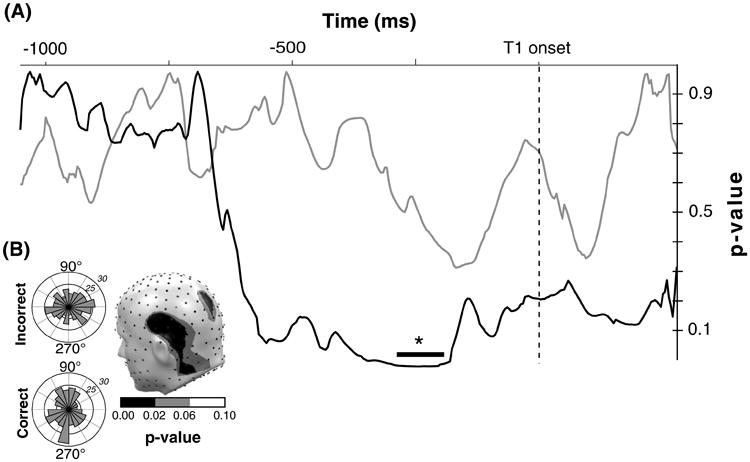
Fig. 5.

a p values across time for incorrect versus correct comparison of ongoing phase for ssVEP (gray) and alpha (black) at one representative sensor. The black bar indicates the time window in which the p values exceeded significance. b Rose plots of the phase angle distribution for all correct (left, bottom) and incorrect trials (left, top) at one representative time point within the time window of significant alpha p values. The topographical distribution of p values of correct versus incorrect alpha phase angles at this time point is illustrated (right)
