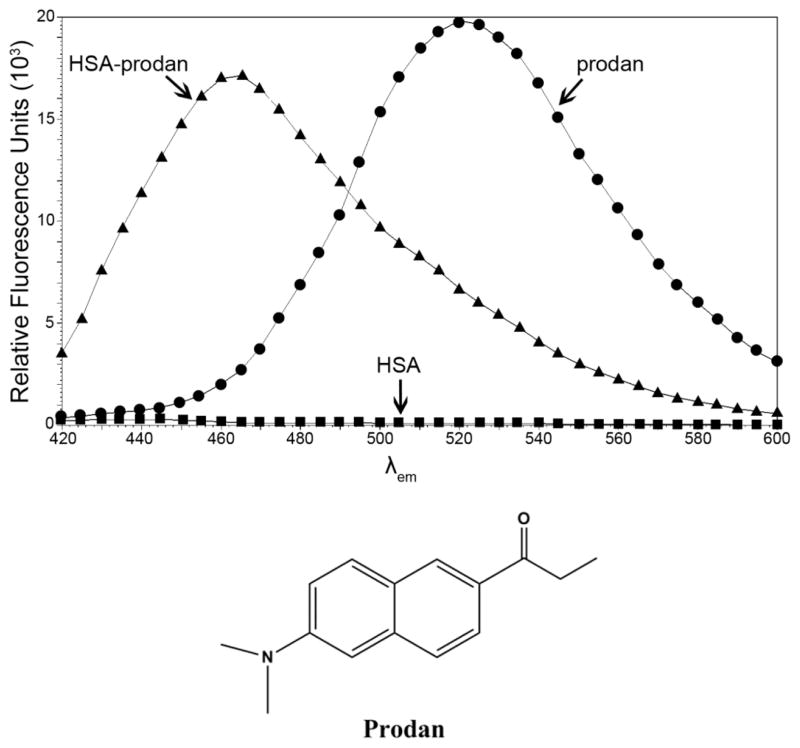
Figure 1. Stoke’s shift of HSA-prodan complex yields fluorescent maxima at 465 nm.
HSA was incubated with a 10-fold excess of prodan and allowed to equilibrate for 30 minutes. Unbound prodan was removed by acetone precipitation and the emission spectra of free prodan, HSA-prodan and HSA were obtained. Excitation λ is 380 nm and upon binding HSA, prodan λmax blue-shifts from 520 nm to 465 nm. HSA without prodan (bottom spectra) shows negligible spectral emission. The endpoint values to monitor prodan displacement from the HSA-prodan complex are 380 nm excitation, 465 nm emission.

