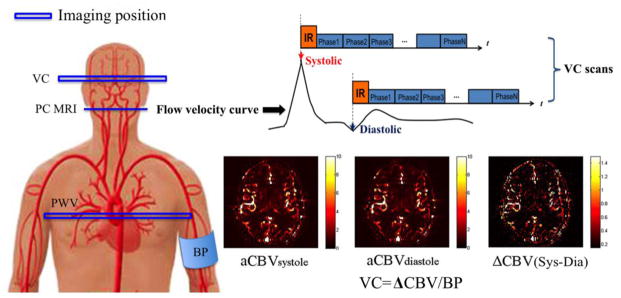
Figure 1.
Illustration of the VC technique applied in the present study. Mean Flow velocity curve in the internal carotid artery (ICA) across the cardiac cycle was acquired using PC MRI, by which the delay time at the peak systolic and early diastolic phases was identified. Intracranial VC was assessed by synchronizing dynamic ASL scans with the systolic and diastolic phases of the cardiac cycle using mutil-phase bSSFP scan. Arterial CBV maps at systole and diastole were calculated based on the tracer kinetic model. Intracranial VC was calculated by the changes in arterial CBV between systole and diastole in response to changes in arterial pressure.

