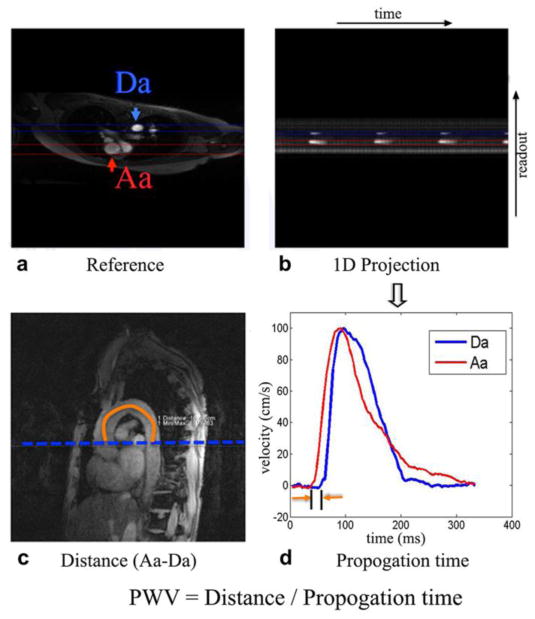
Figure 2.
Aortic arch VC was assessed by quantifying pulse wave velocity (PWV) using non-ECG triggered 1D PC-MRI projection technique. a) the axial reference image, b) the 1D projection image, c) a representative oblique sagittal image, and d) velocity waveforms in the ascending (Aa) and descending (Da) aorta. The imaging plane of PWV was shown in Figure 1. The path length (ΔD) of the pressure wave from the ascending (Aa) to proximal descending (Da) aorta was estimated by manually drawing a line in the center of the aorta from oblique sagittal image (c) of the aorta. The position of high signal intensity in the projection image (b) corresponds to the location of Aa and Da during systole. The propagation time (Δt) in (d) from the location of Aa to Da was calculated from projection image (b). Aortic PWV was computed as ΔD/Δt.

