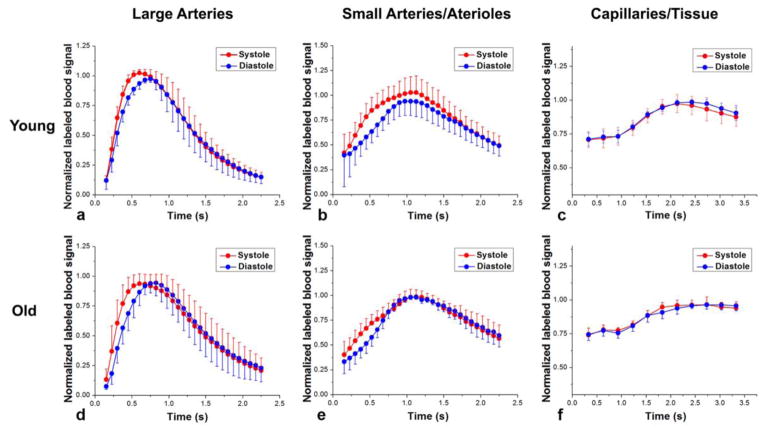
Figure 4.
Mean normalized time courses of multi-phase bSSFP and LL-EPI ASL signals from young (a, b and c) and elderly (d, e and f) subjects with spin tagging applied at the peak systolic (red) and early diastolic (blue) phases in large arteries (a and d), small arteries/arterioles (b and e), and capillary/tissue (c and f) respectively. Error bars indicate standard deviation (SD).

